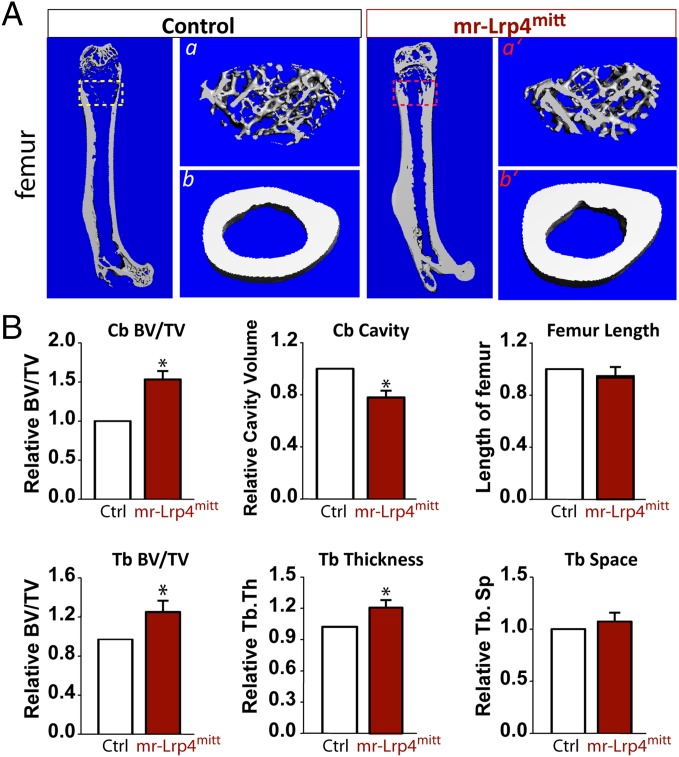
Fig. 1.
High–bone-mass deficit in young adult mr-Lrp4mitt mice. The μCT analysis of femurs from 3-mo-old control (HSA–Lrp4) and mr-Lrp4mitt littermates. Five males per genotype were examined blindly. Representative images are shown in A. The 3D images shown at Right (a, a’, b, and b’) were derived from the marked corresponding regions of the femurs shown at Left. Quantification analyses (mean ± SD, n = 5) are presented in B. *P < 0.05, significant difference.

