Fig. 2.
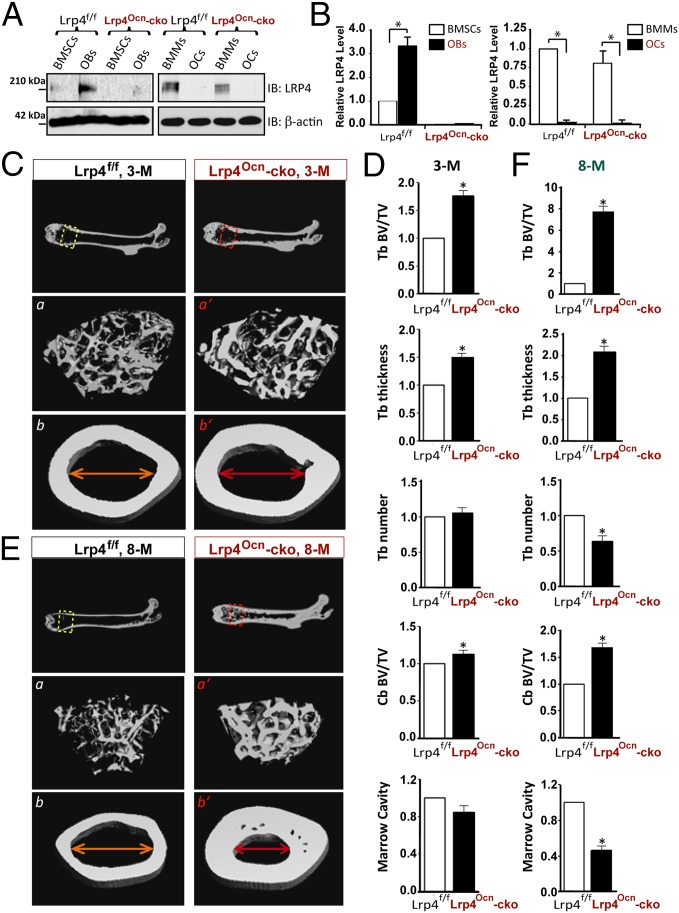
High–bone-mass deficit in Lrp4Ocn-cko mice. (A and B) Western blot analysis of Lrp4 expression in BMSCs, OBs, BMMs, and OCs derived from 2-mo-old Lrp4f/f (control) and Lrp4Ocn-cko mice. Quantification analysis (mean ± SD, n = 3) is presented in B. *P < 0.05, significant difference. (C–F) The μCT analysis of femurs of control (Lrp4f/f) and Lrp4Ocn-cko littermates at ages of 3 mo (C and D) and 8 mo old (E and F). Five males per genotype per age group were examined blindly. Representative images are shown in C and E. The 3D images shown at Bottom (a, a’, b, and b’) were derived from the marked corresponding regions shown at Top. Quantification analyses (mean ± SD, n = 5) are presented in D and F. *P < 0.05, significant difference.

