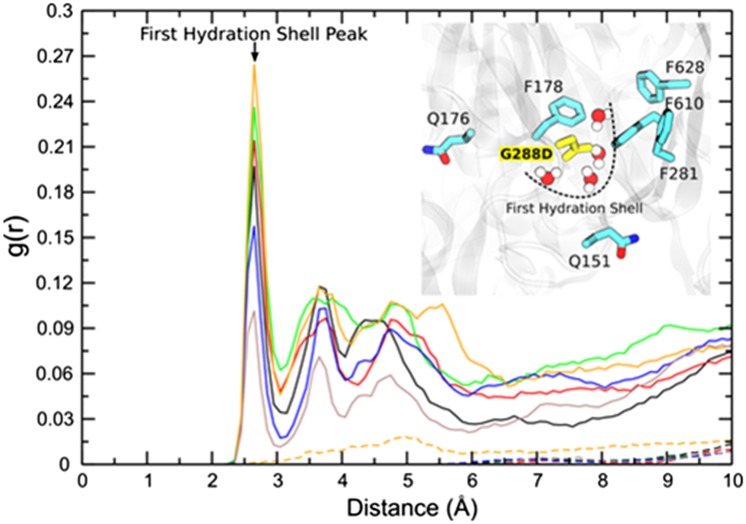
Fig. 2.
RDF profiles indicating the distribution of water molecules near the D288 residue in the mutant (solid lines) protein and near the G288 residue in the wild-type protein (dashed lines). Differently colored lines (solid or dashed) represent the RDF profiles calculated from two different simulations and for each of the monomers of the AcrB protein. RDF profiles are calculated based on the distance between the water oxygen to center of mass of G288/D288 residue’s side chain. (Inset) A representative snapshot of the presence of water molecules in the binding pocket of the G288D mutant protein. Water molecules at the corresponding positions are absent in the wild-type protein.

