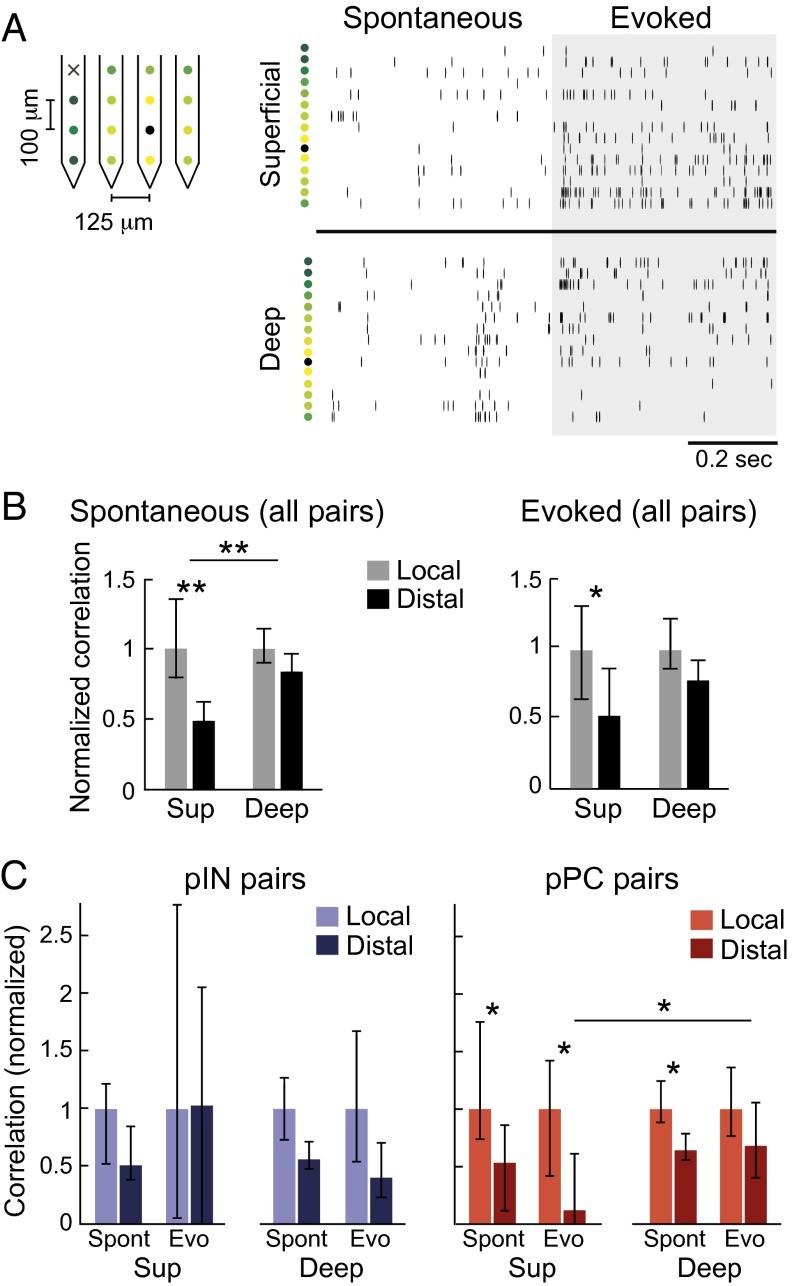
Fig. 5.
Relationship between pairwise correlations and anatomical distance by region and neuron type. (A) Example of simultaneous recordings of multiunit (non–spike-sorted) activity from multiple electrode contacts, in the superficial (Top Right) and deep (Bottom Right) regions. Rasters are organized by increasing distance from the black recording contact. Colored dots to the left of rasters correspond to colors labeling recording contacts on the polytrode (Left). Black “x” indicates a nonfunctional contact. (B) Spatial dependence of normalized noise correlations in superficial and deep regions for spontaneous (Left) and evoked (Right) activity. Local pairs were those in which recorded neurons were ≤150 μm apart. Distal pairs were those in which recorded neurons were ≥300 μm apart. Pairwise correlations in each region were normalized by dividing by the median of the local correlations in that region to place correlations in all regions on the same scale, allowing comparison of correlations between regions. Bars show population medians, and error bars show 95% confidence intervals. Asterisks indicate significant comparisons (Kruskal–Wallis test with multiple groups comparison correction, *P < 0.05, **P < 0.01). Correlations in the superficial region decayed with anatomical distance more than did correlations in the deep region. (C) As in B, but with correlations for pairs of pINs and pairs of pPCs shown separately.

