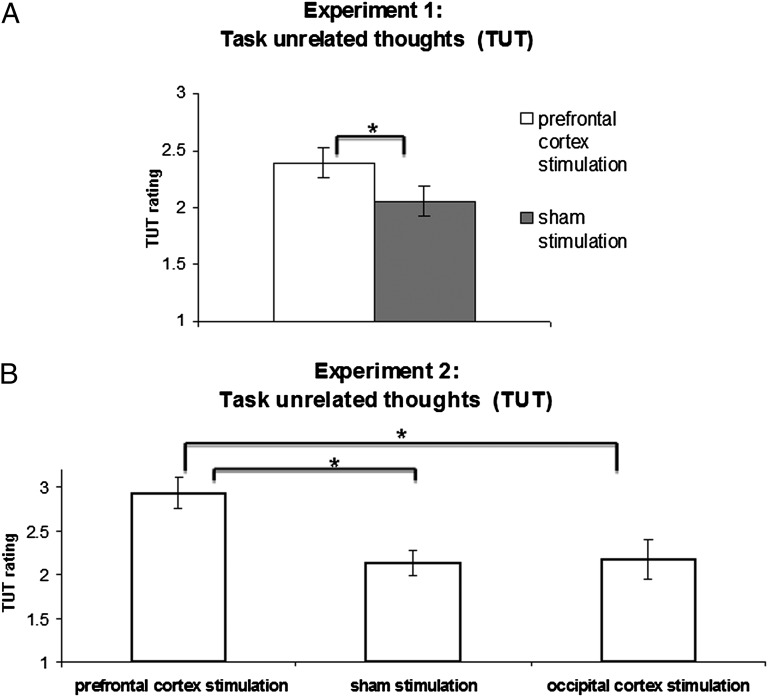
Fig. 3.
TUT results of experiments 1 and 2. (A) Results of experiment 1. The experiment using a within-subjects design included two conditions: prefrontal cortex stimulation and sham stimulation. (B) Results of experiment 2, The experiment using a between-subjects design included three conditions: prefrontal cortex stimulation, sham stimulation, and occipital cortex stimulation. A TUT rating scale ranging from 1 (minimal TUT) to 4 (maximal TUT) was used for both experiments. Analysis of the full experimental length (40 min) is shown. The asterisk denotes a significant difference (P = 0.021 in experiment 1 and P < 0.016 in experiment 2). The error bars denote the SEM.

