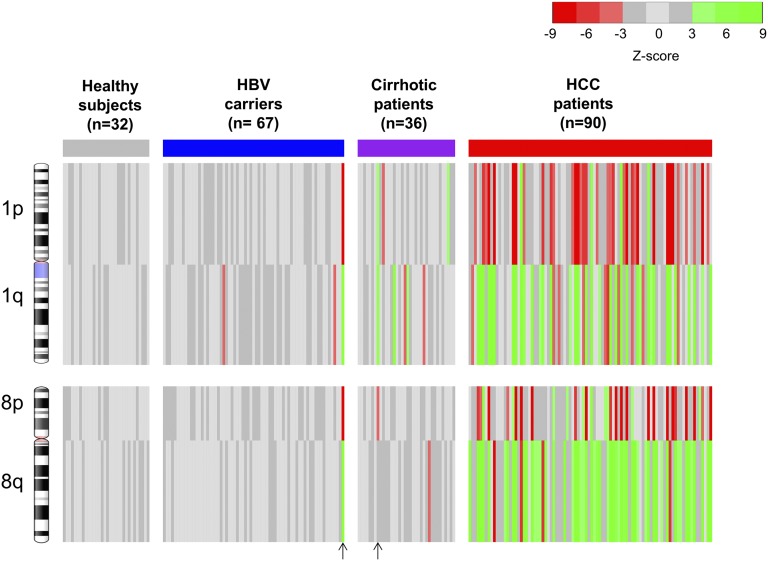
Fig. 2.
Plasma CNA results for all studied subjects by CAZA. The four chromosome arms (1p, 1q, 8p, and 8q) that are frequently affected by CNAs in HCC were analyzed. Red and green lines represent underrepresentation and overrepresentation, respectively, of the corresponding chromosome arms in plasma. Each vertical line represents the data for one case. The vertical arrows at the bottom of the figure indicate the two cases in which HCC was diagnosed 3–4 mo following blood sampling.

