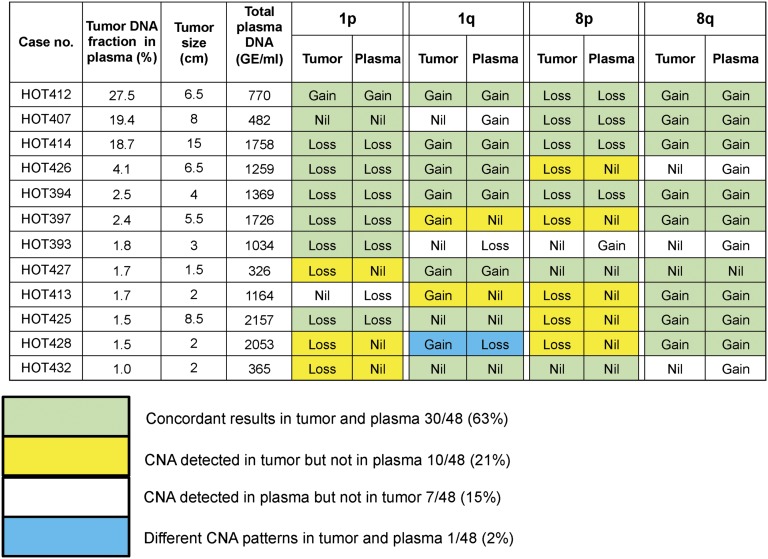
Fig. 3.
CNAs detected in the tumor and corresponding plasma of 12 HCC patients. The patients are arranged in descending order of tumor DNA fraction in plasma. A total of 48 chromosome arms were analyzed for the 12 patients. The numbers (and percentages) of chromosome arms with concordant and discordant results between tumor and plasma are shown.

