
Figure 3.
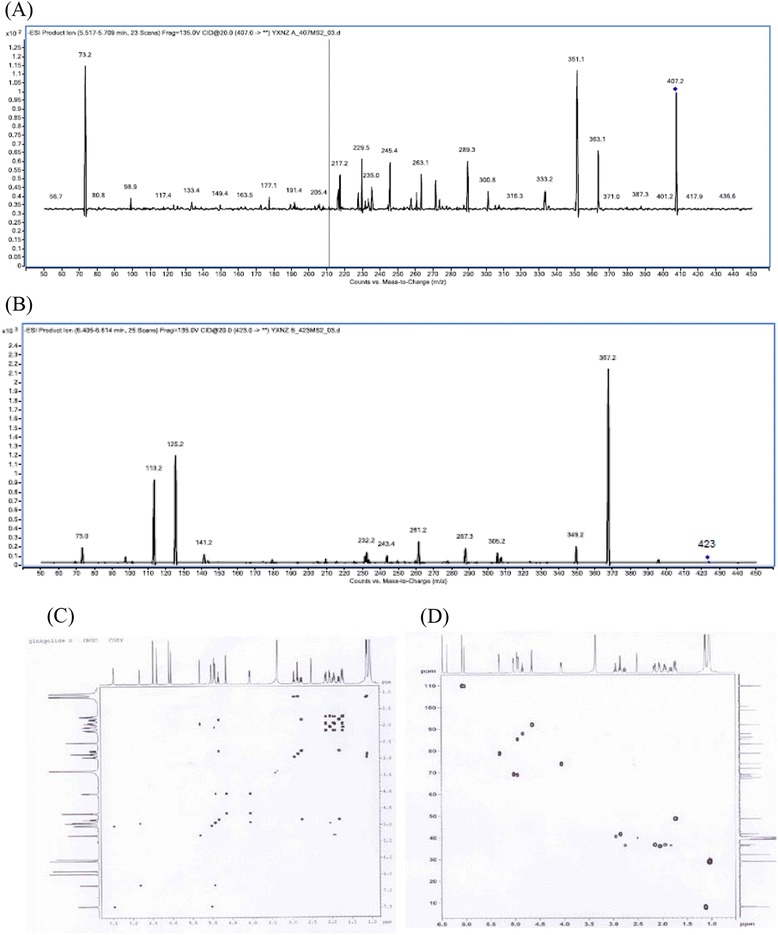
MS/MS and NMR chromatograms of product. (A) ESI-MS (-) MS spectrum of GA (m/z 408); (B) ESI-MS (-) MS spectrum of GB (m/z 423); (C) the 1H-1H COSY spectra; (D) the 1H-13C HSQC spectra.
Official websites use .gov
A
.gov website belongs to an official
government organization in the United States.
Secure .gov websites use HTTPS
A lock (
) or https:// means you've safely
connected to the .gov website. Share sensitive
information only on official, secure websites.
MS/MS and NMR chromatograms of product. (A) ESI-MS (-) MS spectrum of GA (m/z 408); (B) ESI-MS (-) MS spectrum of GB (m/z 423); (C) the 1H-1H COSY spectra; (D) the 1H-13C HSQC spectra.