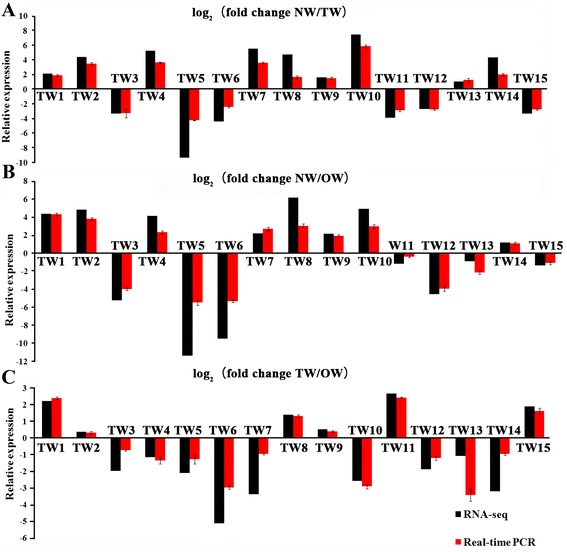
Figure 8.

Comparison of the changes in expression of selected genes detected by RNA-seq and qRT-PCR. A: Comparison of the changes in expression of selected genes detected by RNA-seq and qRT-PCR among NW and TW. B: Comparison of the changes in expression of selected genes detected by RNA-seq and qRT-PCR among NW and OW. C: Comparison of the changes in expression of selected genes detected by RNA-seq and qRT-PCR among TW and OW. The values represent log2 (fold change) among TW, OW, and NW. Error bars indicate standard deviations.
