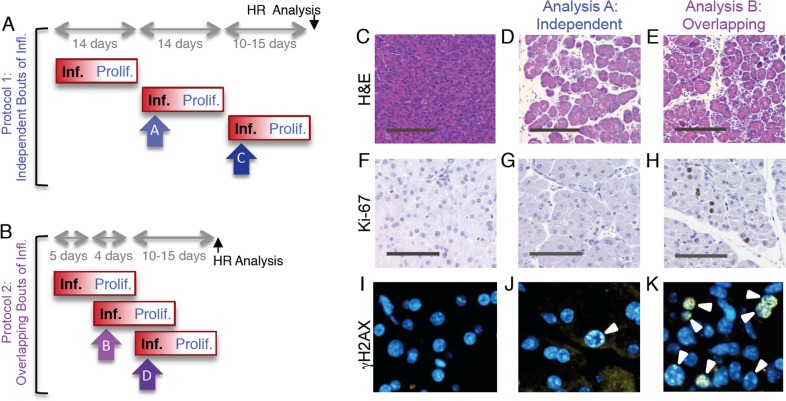
Figure 5. Independent and overlapping bouts of pancreatic inflammation.
(A) For independent bouts of inflammation, three acute cerulein pancreatitis events were induced two weeks apart, and inflammation and proliferation were assessed at the second (analysis time A) and third (analysis time C) bout of inflammation. HR was quantified 10 to 15 days after the last pancreatitis event. (B) For overlapping bouts of inflammation, three acute cerulein pancreatitis events were induced on days 1, 4 and 9. Inflammation and proliferation were assessed at the second (analysis time B) and third (analysis time D) bout of inflammation. HR was quantified 10 to 15 days after the last pancreatitis event. (C) Pancreas section from a control mouse shows healthy tissue. (D,E) Treatment with cerulein (both independent and overlapping) results in edema and an inflammatory infiltrate chiefly of neutrophils, indicating acute inflammation. (F) Ki-67 immunohistochemistry shows low levels of baseline proliferation in control pancreata. (G) Cell proliferation remains low in the pancreas during acute inflammation. (H) During regeneration from acute inflammation, Ki-67 positive nuclei appear, indicating regenerative proliferation. (I) Immunohistochemical detection of γH2AX phosphorylation in pancreas sections show low levels of DSBs in healthy pancreata. (J) During independent bouts of inflammation, nuclei with γH2AX foci (arrowhead) become apparent. (K) During overlapping bouts of inflammation, more γH2AX positive nuclei are visible. (C-E) Original magnification, ×10. Scale bar = 200 μm. (F-H) Original magnification, ×20. Scale bar = 100 μm. (I-K) Original magnification, ×40.

