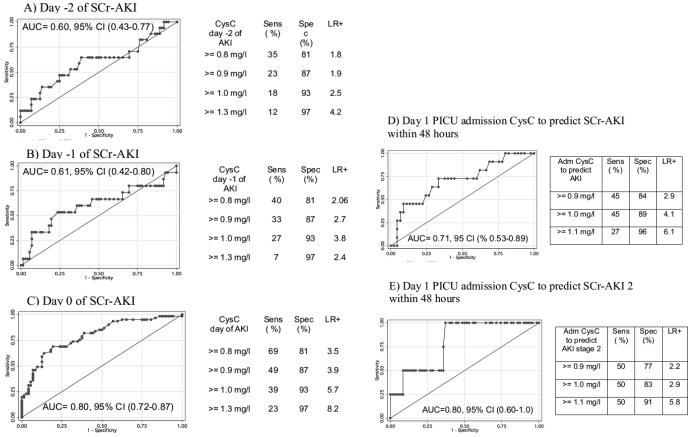
Figure 4. Prediction of SCr-AKI using CysC from 2 to 0 days before SCr-AKI (a to c) and from early PICU admission (d and e).
The figures represent receiver operating characteristic curves for CysC concentrations to diagnose SCr-AKI. Figure A) represents the receiver operating characteristic curve for CysC obtained 2 days before AKI diagnosis; B) for CysC from 1 day before diagnosis; C) for CysC from the day of AKI diagnosis; D) for CysC obtained in early PICU admission to predict SCr-AKI development within 48 hours; E) for CysC obtained in early PICU admission to predict SCr-AKI stage 2 development within 48 hours. Within each graph, the area under the curve (with associated 95% confidence intervals) is shown. To the right of each curve, the sensitivity, specificity and likelihood ratio for selected CysC concentrations cutoffs are shown in association with each graph.
SCR-AKI: acute kidney injury defined by rise in serum creatinine from baseline; AUC: area under the curve; CI: confidence interval; CysC: Cystatin C; AKI: acute kidney injury; Sens: sensitivity; Spec: specificity; LR+: positive likelihood ratio; SCr-AKI 2: acute kidney injury stage 2.

