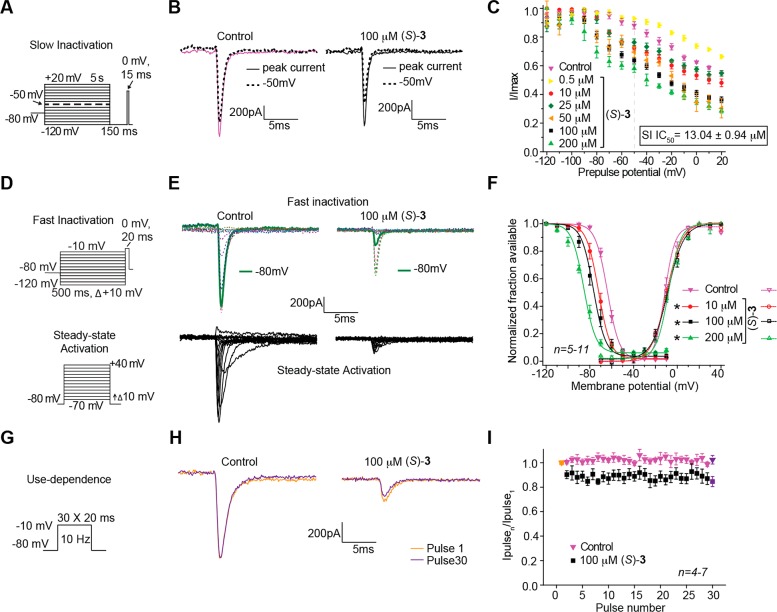
Figure 5.
Effect of (S)-3 on sodium channel properties in CAD cells. (A, D, G) Voltage protocols for examining inactivation, fast inactivation, steady-state activation, and frequency (use)-dependent block. (B, E, H) Representative current traces from CAD cells in the absence (control, 0.1% DMSO) or presence of 100 μM (S)-3. (B) Solid and black dashed traces represent the currents induced at −120 and −50 mV, respectively (−50 mV step highlighted in the voltage protocol). (C) Summary of the inactivation curves for CAD cells treated with 0.1% DMSO (control) or 0.5−200 μM (S)-3. The concentrations of half maximal effect for −50 mV conditioning pulse (see text for detailed explanations), the IC50, is indicated. (E) Representative current traces (top, fast inactivation; bottom, steady-state activation). (F) Representative Boltzmann fits for steady-state fast inactivation and steady-state activation for CAD cells treated with 0.1% DMSO (control) or 10–200 μM of (S)-3. Values for V1/2, the voltage of half-maximal inactivation and activation, and the slope factors (k) were derived from Boltzmann distribution fits to the individual recordings and were averaged to determine the mean (±SEM) voltage dependence of steady-state inactivation and activation, respectively. Statistically significant differences between fits of fast inactivation from control cells (0.1% DMSO) compared to 10–200 μM of (S)-3 are indicated by the asterisks (*, p < 0.05, one-way ANOVA). (H) Representative overlaid traces are illustrated by pulses 1 and 30 for control (predrug) and in the presence of (S)-3 (100 μM). (I) Summary of average frequency (use)-dependent decrease in current amplitude over time (±SEM) produced by control (0.1% DMSO) or 100 μM (S)-3. Data are from 4–13 cells per condition.

