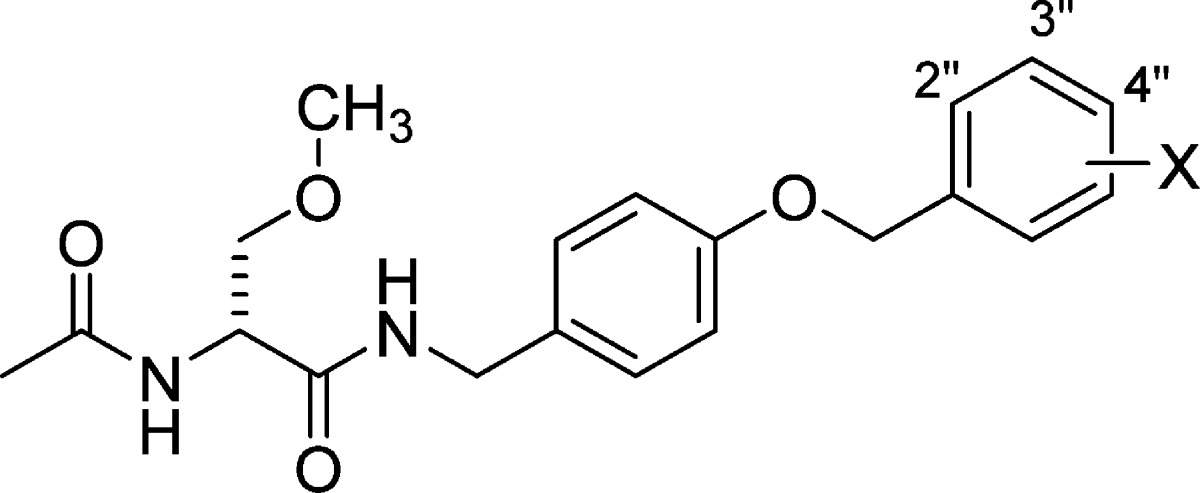
Table 1. Structure–Activity Relationship for Substituted (R)-N-4-(Benzyloxy)benzyl 2-Acetamido-3-methoxypropionamide Derivativesa.

| mice (ip)b |
rat (po)g |
||||||||
|---|---|---|---|---|---|---|---|---|---|
| compd no. | X | MES, ED50 (mg/kg)c | 6 Hz ED50 (mg/kg)d | Tox, TD50 (mg/kg)e | PIf | MES, ED50 (mg/kg)c | Tox, TD50 (mg/kg)h | PIf | IC value (μM)i |
| (R)-4j | H | 5.8 [0.25] (4.4–7.2) | <15 [0.25–5.0] | 22 [0.25] (19–25) | 3.8 | 5.6 [0.25] (4.2–6.4) | >250 [1.0] | >45 | 1.6k |
| (R)-5j | 2″-F | 6.7 [0.25] (4.8–9.1) | NDl | 37 [0.5] (29–48) | 5.5 | 11 [0.5] (7.9–13) | >500 | >45 | 1.6k |
| (R)-1j | 3″-F | 13 [0.25] (11–16) | ∼10 [0.25] | 26 [0.5] (21–34) | 2.0 | 14 [0.5] (6.1–27) | >500 [0.25–6.0] | >36 | 1.7k |
| (R)-6j | 4″-F | >10, <30 [0.5] | NDl | >30, <100 [0.5] | 5.8 [0.5] (4.3–7.3) | >500 [0.25–6.0] | >86 | NDl | |
| (R)-7 | 3″-Cl | 16 [0.5] (10–26) | 13 [0.5] (7.7–23) | 190 [2.0] (140–260) | 12 | 39 [6.0] (25–63) | >500 | >13 | 0.34 |
| (R)-8 | 4″-Cl | 7.2 [0.5] (4.3–13) | 7.6 [0.25] (4.5–11) | 49 [0.5] (29–66) | 6.8 | 17 [1.0] (12–25) | >500 | >29 | 0.31 |
| (R)-9 | 3″-OCF3 | 12 [0.5] (6.6–21) | 12 [0.5] (6.8–24) | 38 [0.5] (31–47) | 3.2 | 9.8 [2.0] (4.8–17) | >500 | >51 | 0.24 |
| (R)-10 | 4″-OCF3 | 8.3 [1.0] (7.4–9.8) | 23 [1.0] (14–31) | 39 [0.5] (33–47) | 4.7 | 20 [2.0] (8.9–52) | 250–500 [1.0–6.0] | >13 | 0.14 |
| (R)-2mn | 4.5 [0.5] (3.7–5.5) | 10 [0.5] (7.8–13) | 27 [0.25] (26–28) | 6.0 | 3.9 [2.0] (2.6–6.2) | >500 [0.5] | >130 | 85 | |
| (S)-3o | 4.1 (3.0–5.5) | NRp | NRp | – | 12 (10–14) | NRp | – | 13 | |
| phenytoinq | 9.5 [2.0] (8.1–10) | 66 [2.0] (53–72) | 6.9 | 30 [4.0] (22–39) | >100 | ||||
| phenobarbitalq | 22 [1.0] (15–23) | 69 [0.5] (63–73) | 3.2 | 9.1 [5.0] (7.6–12) | 61 [0.5] (44–96) | 6.7 | |||
| valproateq | 270 [0.25] (250–340) | 430 [0.25] (370–450) | 1.6 | 490 [0.5] (350–730) | 280 [0.5] (190–350) | 0.6 | |||
The compounds were tested through the NINDS ASP.
The compounds were administered intraperitoneally. ED50 and TD50 values are in milligrams per kilogram. Numbers in parentheses are 95% confidence intervals. A dose–response curve was generated for all compounds that displayed sufficient activity. The dose–effect for these compounds was obtained at the “time of peak effect” (indicated in hours in the brackets).
MES = maximal electroshock seizure test.
6 Hz = 6 Hz psychomotor seizure test.
TD50 value determined from the rotorod test.
PI = protective index (TD50/ED50) in the MES test.
The compounds were administered orally. ED50 and TD50 values are in milligrams per kilogram. Numbers in parentheses are 95% confidence intervals. A dose–response curve was generated for all compounds that displayed sufficient activity. The dose–effect for these compounds was obtained at the “time of peak effect” (indicated in hours in the brackets).
Tox = behavioral toxicity.
IC50, concentration at which half of the Na+ channels have transitioned to an inactivated state.
Reference (1).
Reference (11).
ND = not determined.
Reference (2).
Reference (13).
Reference (5).
NR = not reported.
Reference (38).
