
Figure 5.
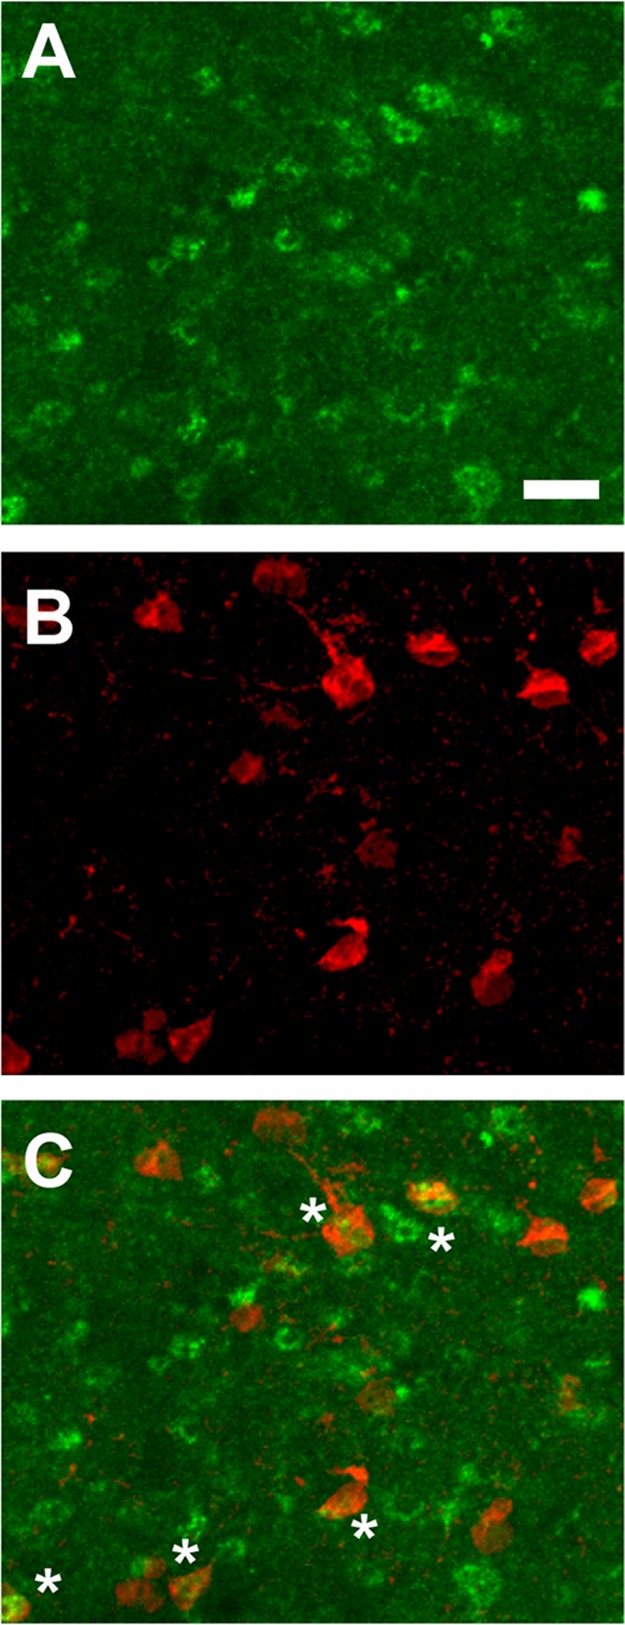
Representative micrographs of colocalization of GFP (indicating the D2R; A, green) and PV (B, red) in the ACC of D2eGFP BAC transgenic mice (N = 5). Colocalized neurons are apparent in the merged image (C), as denoted by asterisks (*). Scale bar = 25 μm.