Figure 4.

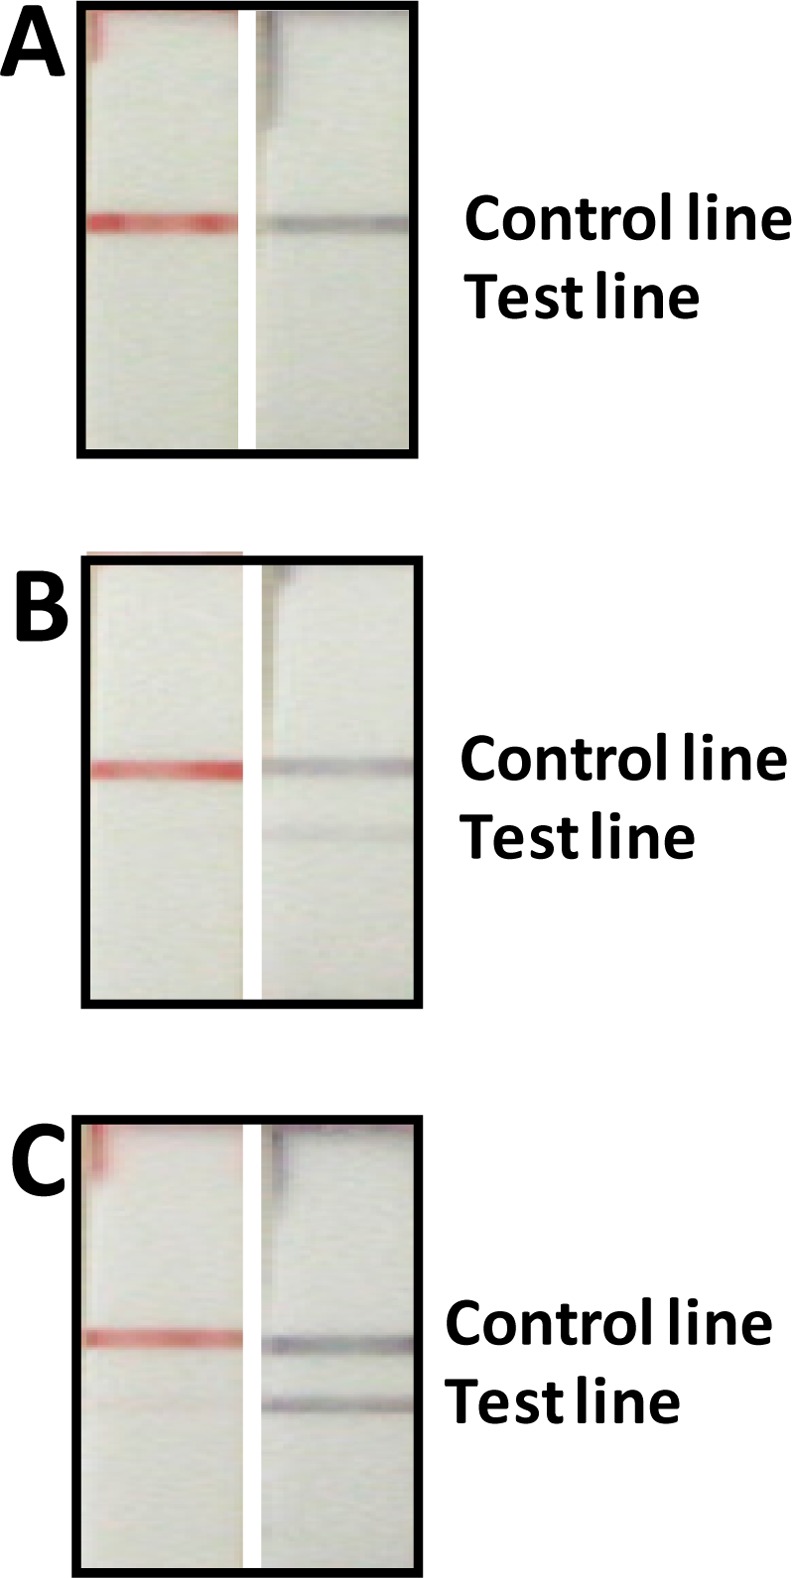
Photo images of the GNP-based LFSBs (left) and the GNP-SiNR-based LFSBs (right) in the presence of different concentrations of rabbit IgG: (A) 0 ng mL–1, (B) 1.0 ng mL–1, and (C) 5.0 ng mL–1.

Photo images of the GNP-based LFSBs (left) and the GNP-SiNR-based LFSBs (right) in the presence of different concentrations of rabbit IgG: (A) 0 ng mL–1, (B) 1.0 ng mL–1, and (C) 5.0 ng mL–1.