Figure 7.

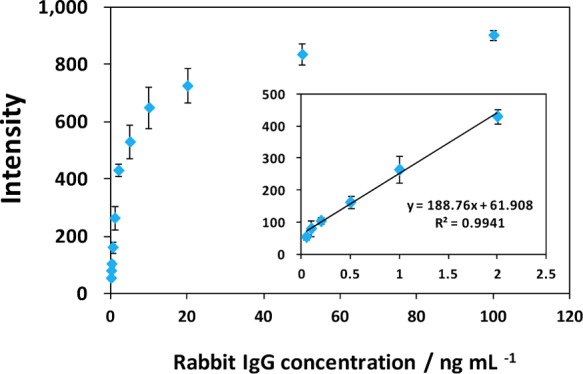
Calibration curve of the LFSB. The inset shows the linear response for rabbit IgG. Each data point represents the average value obtained from three different measurements.

Calibration curve of the LFSB. The inset shows the linear response for rabbit IgG. Each data point represents the average value obtained from three different measurements.