
Figure 5.
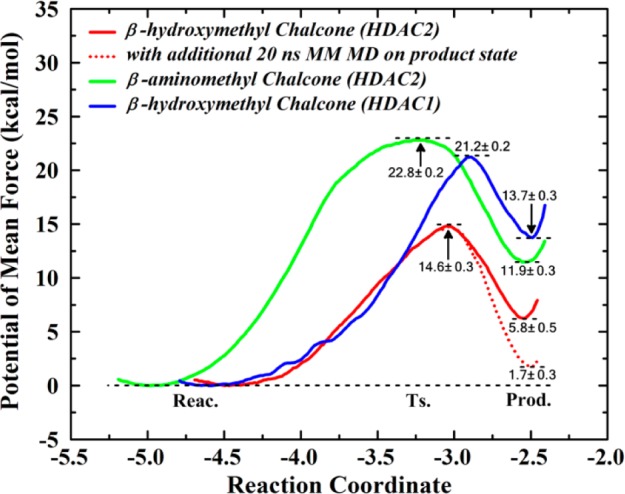
The comparison of the free energy profiles for the intramolecular nucleophilic attack reaction in each model. The statistical error is estimated by averaging the free energy difference between 5 and 13 and 13 and 20 ps. And the corresponding active structure of each reaction state for the β-substitutional chalcone in HDAC2 is shown in Figure S10c–h.