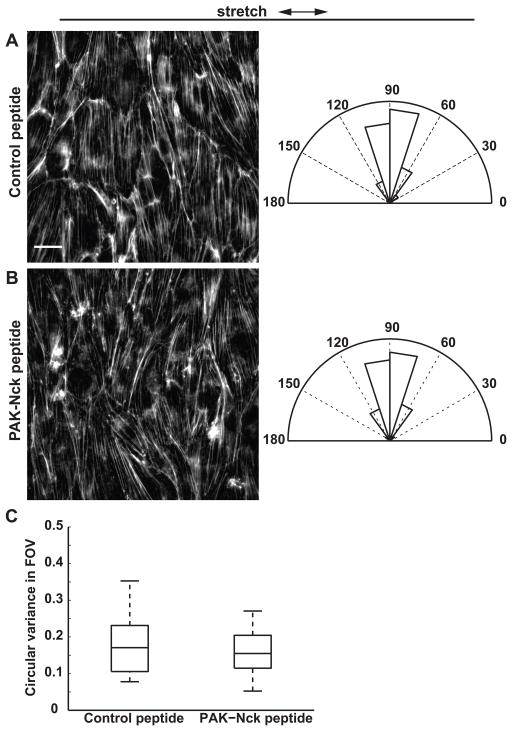
Figure 10.
Effect of PAK inhibition on stretch-induced SF reorientation. (A–B) ECs were pretreated with (A) control peptide or (B) PAK-Nck inhibitory peptide for 1 h and subjected to cyclic uniaxial stretch for 4 h. Arrows indicate stretch directions. Scale bar, 20 μm. Rose plots show normalized angular distribution of F-actin orientations computed in 64×64-pixel subimages (n > 3000 subimages in 15 fields of view in 3 experiments). (C) Circular variance of SF orientations within individual fields of view. On each box, central mark: median; edges: 25th and 75th percentiles; whiskers: most extreme data points. (n = 15 fields of view in 3 experiments)

