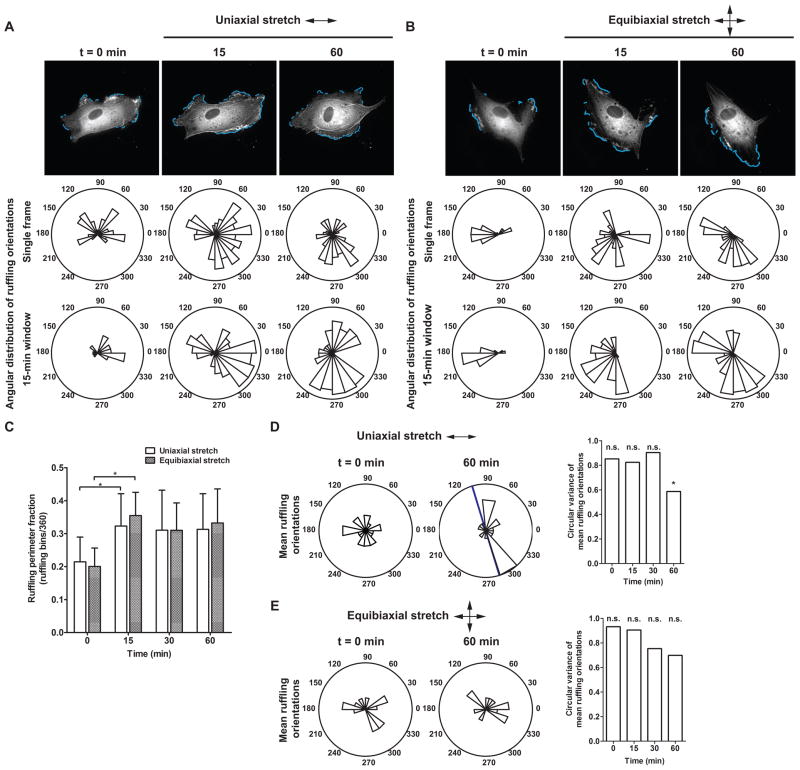
Figure 2.
EGFP-actin dynamics in response to cyclic stretch. (A, B) Time-lapse images of ECs in a confluent monolayer subjected to (A) cyclic uniaxial stretch and (B) cyclic equibiaxial stretch. Rose plots show the angular distribution of edge ruffles in the corresponding image and during a 15-min measurement window. Arrows indicate stretch directions. Scale bars, 20 μm. (C–E) Effect of cyclic stretch on the magnitude and orientation of actin edge ruffling. (C) Mean ruffling perimeter fraction, computed as the ratio of the number of angular bins engaged in ruffling to the total number of angular bins. (*, p < 0.05, t-test compared to t = 0 min) (D, E) Circular variance computed from the angular distribution of mean ruffling orientations of individual cells. Rose plots show mean ruffling orientations of individual ECs at indicated times. Blue bar indicates mean ruffling orientation across multiple cells. Arrows indicate stretch directions. (*, p < 0.05, v-test, unimodal alternative of 90°) (Uniaxial stretch: n = 20 cells; equibiaxial stretch: n = 14 cells from separate experiments)

