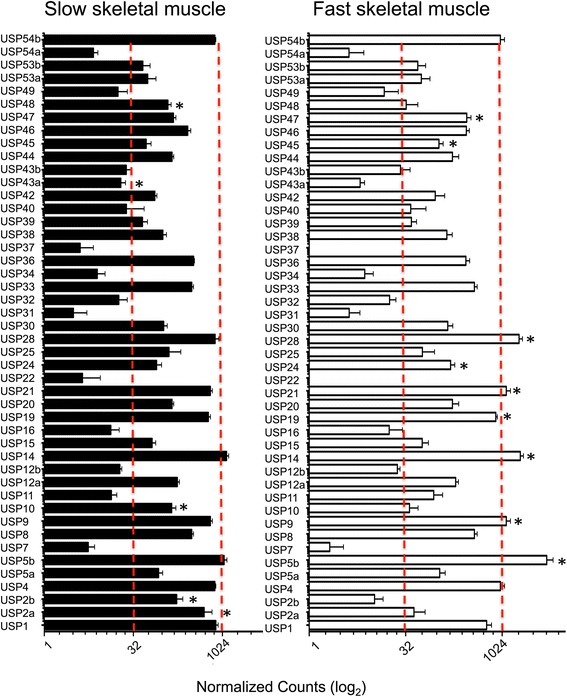
Figure 4.

USP digital gene expression in fast and slow skeletal muscle. Digital gene expression for all USPs is represented using a 2-logarithmic scale for slow (full bars) and fast (empty bars) skeletal muscle. Significant differences and between fibre types (FDR < 0.05) are indicated (*). Values represent mean ± SE (n = 5).
