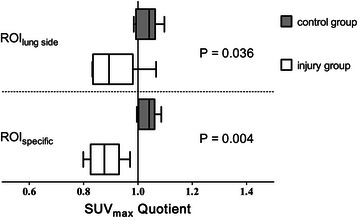
Figure 3.

PBF ratios for ROIlungsideand ROIspecific. PBF ratio expressed as the median of the quotients of the maximum standardized uptake value (SUVmax) in the left versus right side in the control group (n = 6) and injured versus uninjured side in the acid aspiration group (n = 5) for each lung (ROIlungside) and for a spherical region of interest of 0.24 cm3 (ROIspecific). The data are shown as the median [25th and 75th percentiles] and the minimum to maximum values. Lower mean concentrations of Ga-68 microspheres in the injured region yield a PBF ratio < 1 in ROIlung side or ROIspecific. P compared with the control group.
