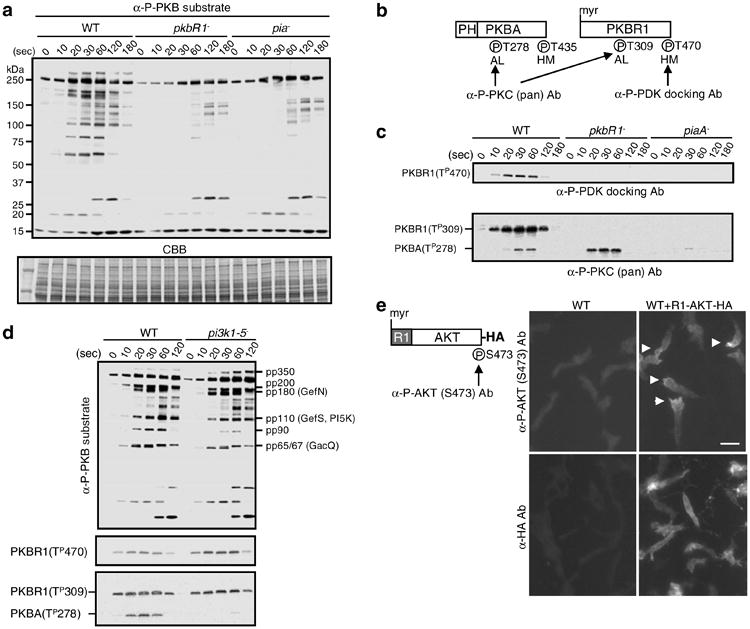
Fig. 3.

Assays to detect TorC2 and PKB activities. (a) The in vivo PKB activity is evaluated by antiphospho PKB substrate antibody (α-P-PKB substrate). The bands of pp350, pp200, pp180, pp110, pp90, and pp65/67 in WT cells are dependent on the activities of PKBR1 and PiaA, a subunit of TorC2. CBB (coomassie brilliant blue) staining is for the loading control. (b) The schematic structures of PKBA and PKBR1 are shown. The phosphorylation sites (P) can be detected by the antibodies, antiphospho PDK docking motif antibody (α-P-PDK docking Ab), and antiphospho PKC (pan) antibody (α-P-PKC (pan) Ab). The labels AL and HM refer to activation loop and hydrophobic motif. (c) The upper panel shows the phosphorylation at T470 of PKBR1 in WT, pkbR1−, piaA− cells by α-P-PDK docking Ab. The lower panel shows the phosphorylations at T278 of PKBA and T309 of PKBR1 in WT, pkbR1−, piaA− cells by α-P-PKC (pan) Ab. (d) The PKB activity, the phosphorylation of T470 of PKBR1 by α-P-PDK docking Ab, and the phosphorylations of T278 of PKBA and T309 of PKBR1 by α-P-PKC (pan) Ab are compared in between WT and pi3k1−-5− cells. (e) The schematic structure of R1-AKT-HA is shown with the phosphorylation sites (P) that are detected by the antiphospho AKT (S473) antibody (α-P-AKT (S473) Ab). In the right panel, chemotaxing cells are stained with α-P-AKT (S473) Ab to detect the phosphorylation of S473 or α-HA Ab for the localization of R1-AKT-HA. Arrow heads show localized staining. The scale bar represents 10 μm. (Reproduced from ref. 10 with permission from Elsevier Science.).
