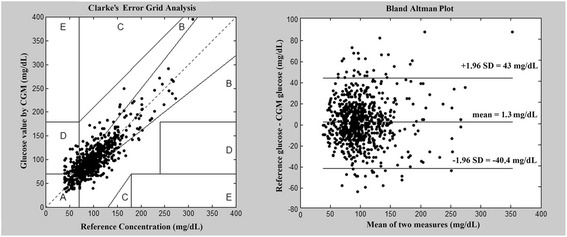
Figure 1.

Left side: Clarke Error Grid analysis. The clinical accuracy of CGM was 96% as a result of 780 CGM – reference glucose pair analysis. Right side: Bland Altman plot, representing CGM – reference glucose differences in function of mean glucose values.
