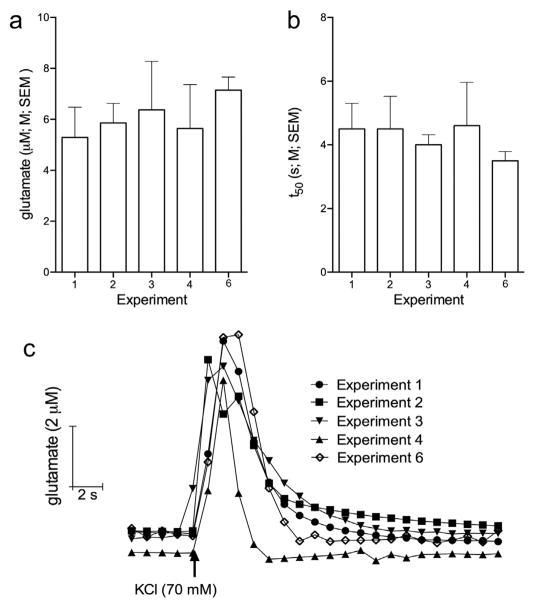
Fig. 5.
Glutamate signals evoked by KCl. Bar charts depicting the average peak amplitudes (a) and decay rates (b) of KCl-evoked glutamatergic transients in Experiments 1–4, and 6 (see Fig. 1). c Representative traces depicting KCl-evoked glutamate signals recorded at t = 285 min for Experiments 1–4 and t = 0 min for Experiment 6. Peak amplitudes and decay rates of KCL-evoked glutamatergic transients did not differ between the Experiments (see Results for ANOVA).

