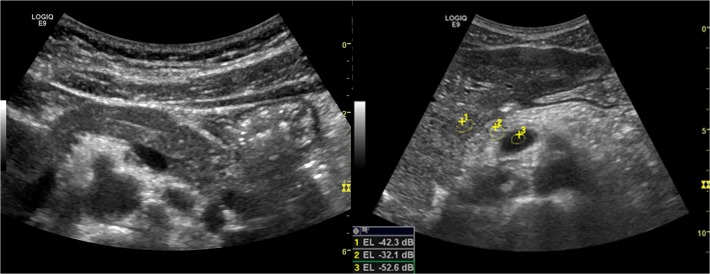
Fig 2. Pancreas ultrasonography.
The figure is displaying a normal pancreas in pancreas sufficient patient (left) and a typical hyper echoic pancreas in an insufficient patient (Right). The Visual score graded echogenicity 1 for the left pancreas and 4 for the right pancreas. The image to the right display region of interest (ROI) for Echo intensity measures (1: Liver, 2: pancreas, 3: Vessel (superior mesenteric vein)).

