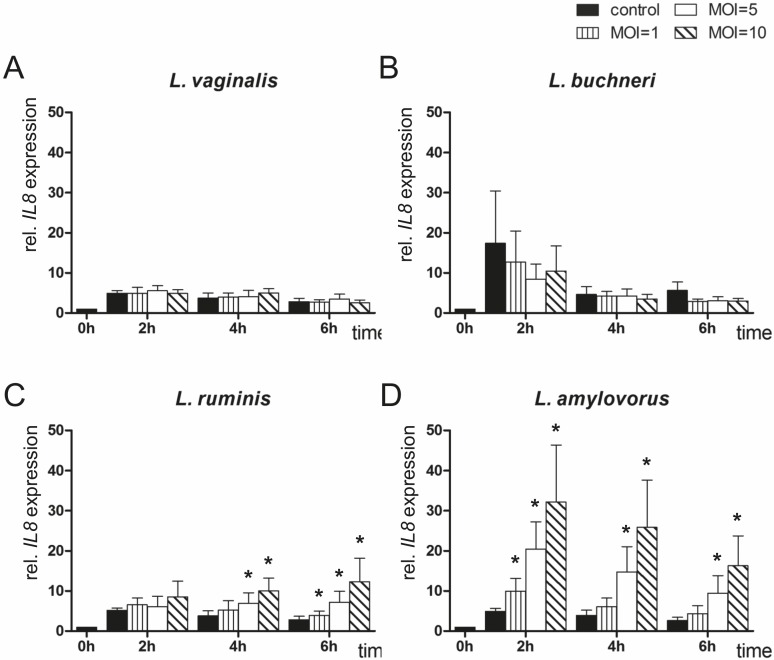
Fig 3. Expression analysis of IL8 by means of RT-qPCR.
IL8 mRNA expression was determined in bovine endometrial epithelial cells after co-culture with (A) L. vaginalis; (B) L. buchneri; (C) L. ruminis; and (D) L. amylovorus in MOI 1, 5 and 10 for up to 6 h (n = 5 animals). All expression values were calculated relative to the individual expression of ACTB, GAPDH and SDHA as internal control. Normalised data were scaled relative to the expression in control cells at time 0 h, which was defined as one. Bars represent means ± SEM; * = P < 0.05.

