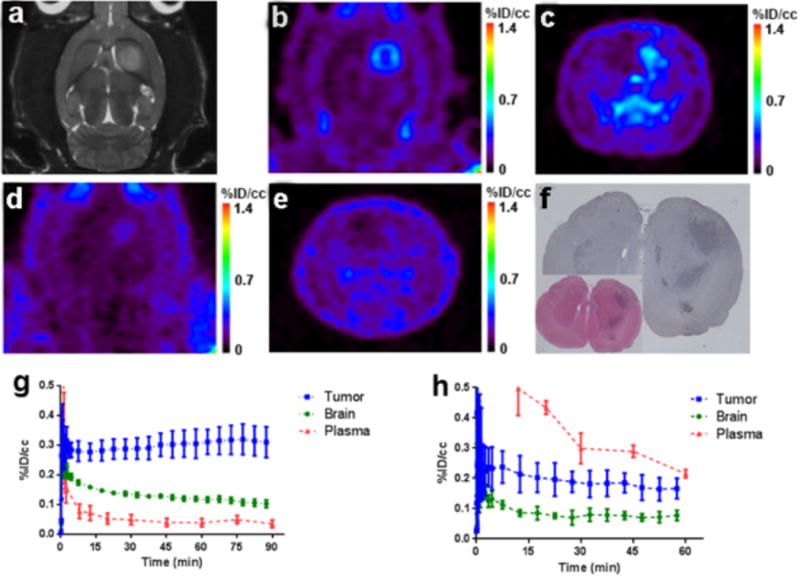
Figure 3. 18F-VUIIS1008 accumulation and target specificity in C6 glioma.

(a) T2-weighted MRI of a representative C6-bearing rat; lesion exhibits hyperintensity in the right hemisphere. Corresponding PET study 18F-VUIIS1008 (transverse view, b; coronal view, c). Uptake characteristics of 18F-VUIIS1008 following a pre-PET block with VUIIS1008 (10 mg/kg) in the same rat (transverse view, d; coronal view, e). (f/g) Imaging-matched brain from the study rat shown; TSPO immunoreactivity (f) and H&E staining (g). (h) Mean TACs for the un-blocked 90-min dynamic scan (n = 6). (i) Mean TACs for the pre-blocked scan with 60-min dynamic PET scans (n = 4). %ID/cc = percentage injected dose per cubic centimeter. In TACs, Data = Mean ± SD. R and L in the image denote the right and left side of the rats imaged individually.
