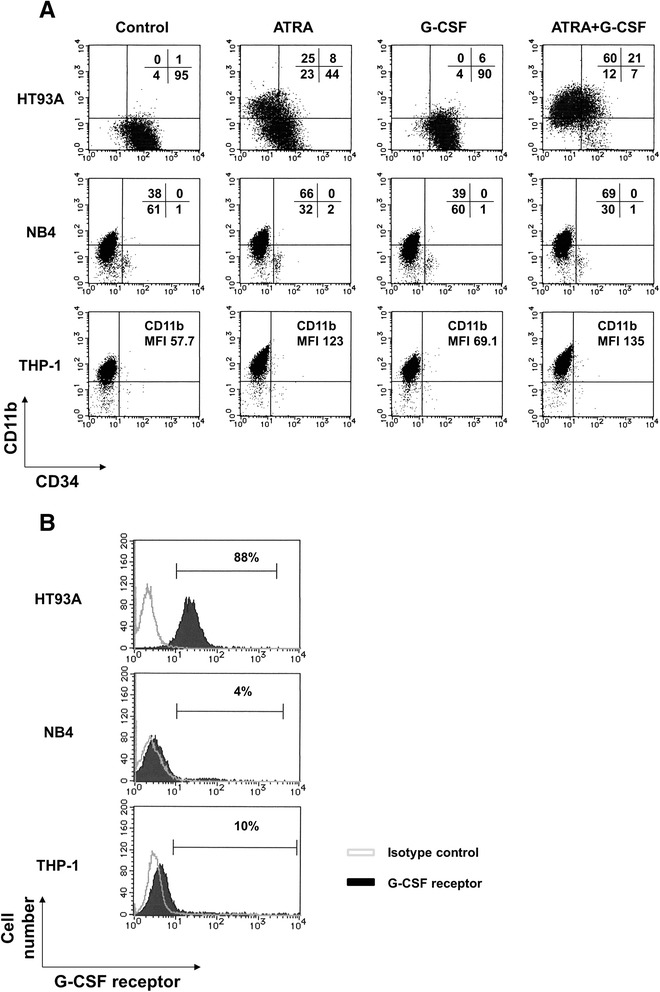
Figure 1.

Granulocytic differentiation and G-CSF receptor expression. Differentiation profile of surface antigen expression in HT93A, NB4 and THP-1 cells (A). These cell lines were treated with 100 nM ATRA and 50 ng/mL G-CSF, alone or in combination, for 7 days (HT93A) and 48 h (NB4 and THP-1). Because THP-1 cells express high levels of CD11b in the control, CD11b expression is reported as the mean fluorescence intensity (MFI). Expression of G-CSF receptor in HT93A, NB4, and THP-1 cells (B). HT93A specifically exhibited ATRA-induced CD11b expression and a decline in CD34, with strong G-CSF receptor expression. Expression profiles of CD11b, CD34, and G-CSF receptor were evaluated by flow cytometry. Experiments were performed twice or three times, each yielding similar results.
