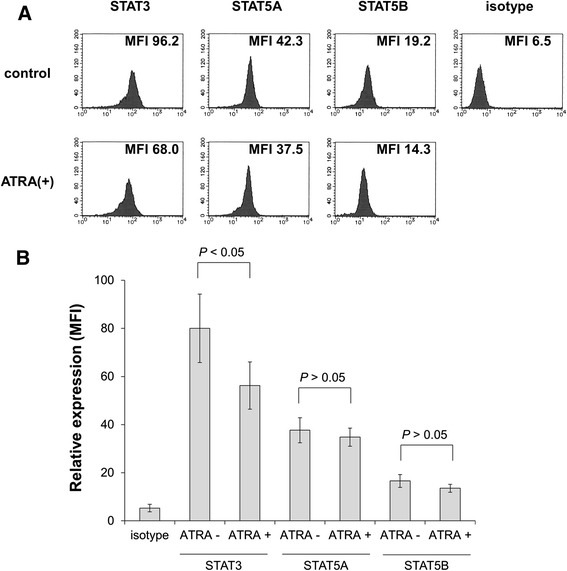
Figure 2.

Flow cytometry to assess expression of STATs in HT93A cells. After treatment with or without 100 nM ATRA for 5 days, STAT3, STAT5A, and STAT5B expression was evaluated. Histograms (A) and bar graphs (B) represent STAT3, STAT5A, and STAT5B expression in the presence or absence of ATRA. Experiments were independently repeated three times and results are shown as mean ± SD. NS not significant.
