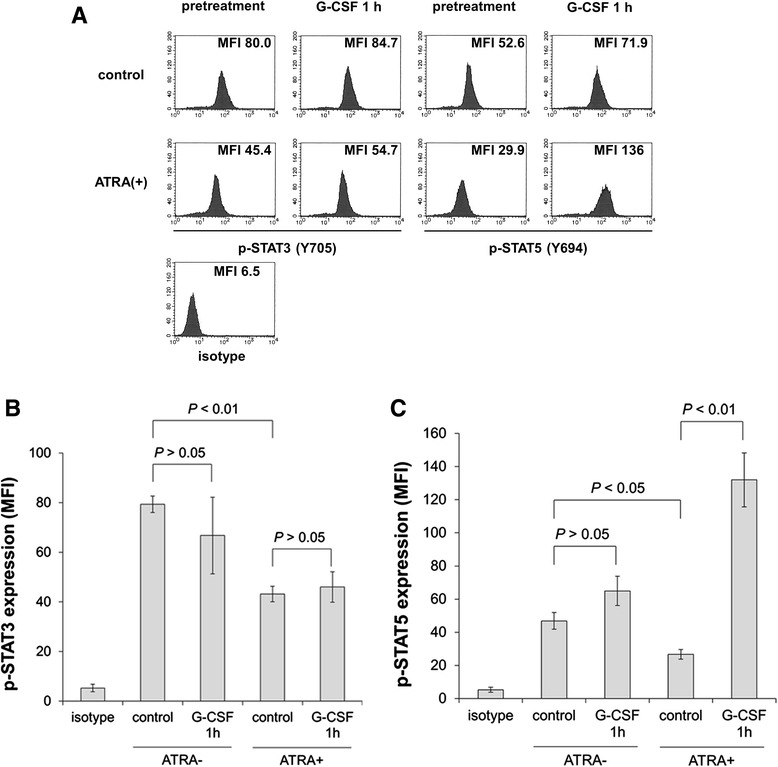
Figure 3.

Flow cytometry analysis of phosphorylated STAT expression in HT93A cells. After treatment with or without 100 nM ATRA for 5 days, expression of phosphorylated STATs was evaluated before or after 50 ng/mL G-CSF stimulus for 60 min. Histograms (A) and bar graphs represent phosphorylated STAT3 (B) and STAT5 (C) expression. Experiments were independently repeated three times and results are shown as mean ± SD. NS not significant.
