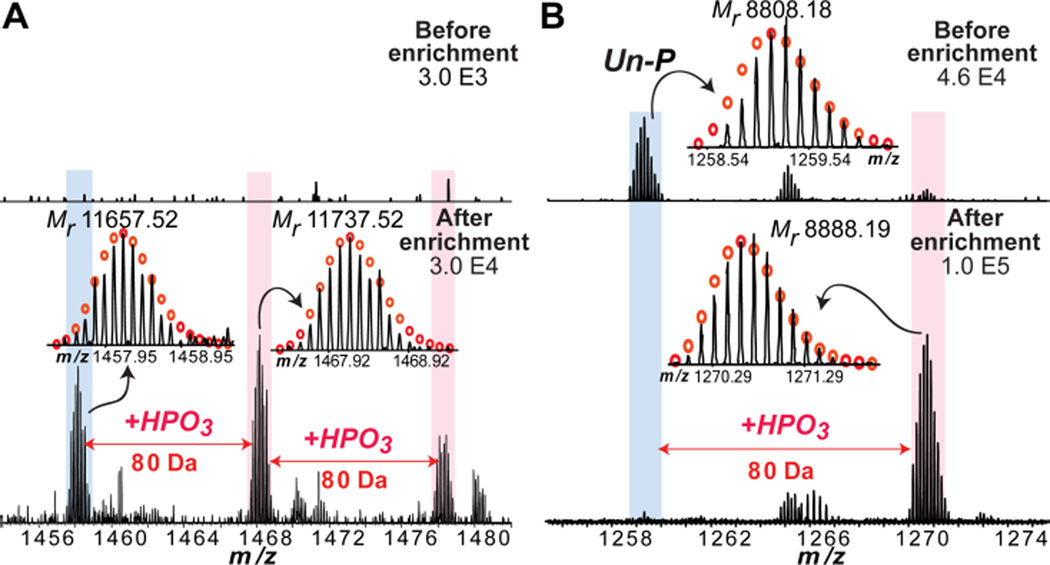
Figure 3.
Representative intact protein MS spectra, before and after enrichment, confirming the highly specific enrichment of phosphoprotein from a swine heart tissue extract. (A) shows a low abundance phosphoprotein that is not detectable before enrichment (top) is detected after enrichment (bottom); and (B) shows a phosphoprotein with very low phosphorylation occupancy that the un-phosphorylated form (un-P) is predominant before the enrichment but the phosphorylated form (+P) becomes dominant after the enrichment. Mr represents most abundant molecular weight. +HPO3, the covalent addition of a phosphate group (+80 Da).

