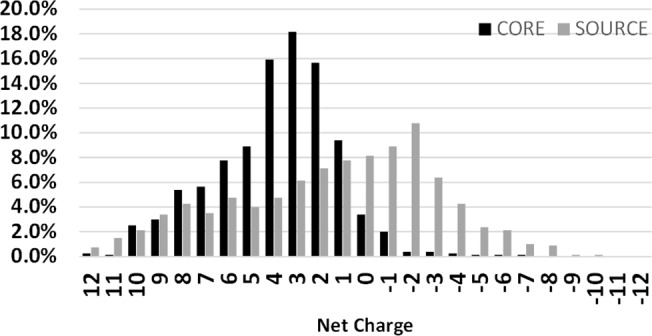
Fig 5. Statistical distribution of the net charge of AMP critical regions and the background.

Less than 3% of the AMP critical regions and source proteins (background) having net charge over ±12 is not shown here.

Less than 3% of the AMP critical regions and source proteins (background) having net charge over ±12 is not shown here.