
Fig 4. Bacterial NO generation and correlation with acidity of the growth medium.
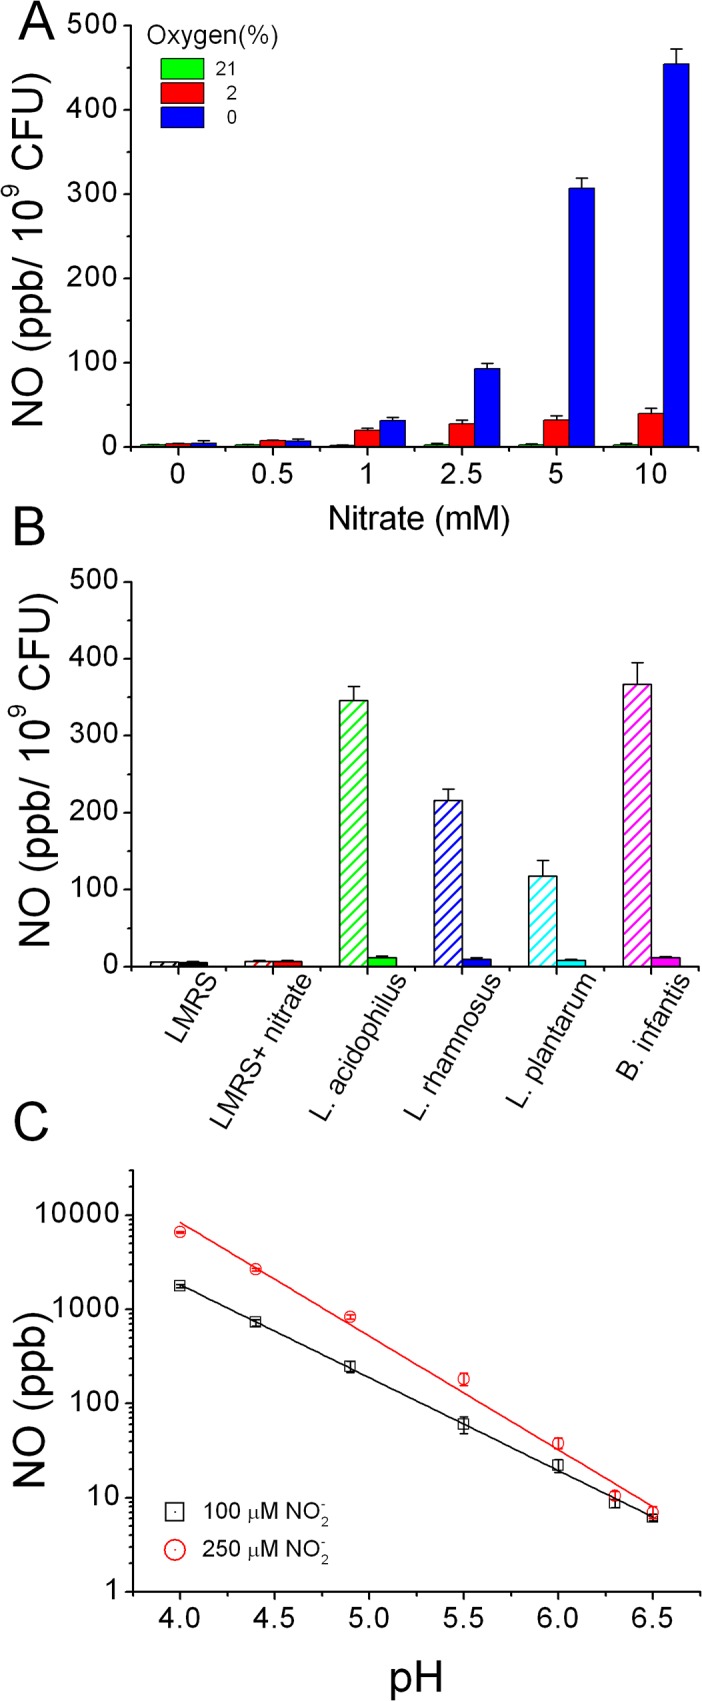
(A) Chemiluminescence detection of NO emission after injection of 100 μM nitrite in the vessel containing E.coli grown at different nitrate and oxygen conditions in modified LMRS broth for 24h. (B) Comparison of NO emission at 2% O2 as in panel A, but using LAB cultures. Diagonal patter and solid bars indicate respectively the values detected before and after bacteria were re-suspended in fresh media at pH = 6.5 (as described in text). (C) Quantification of the amount of NO detected after injection of 100 μM or 250 μM nitrite in fresh LMRS media at different pH obtained by acidification with concentrated L-lactic acid. All data represent mean ± SD in duplicates.