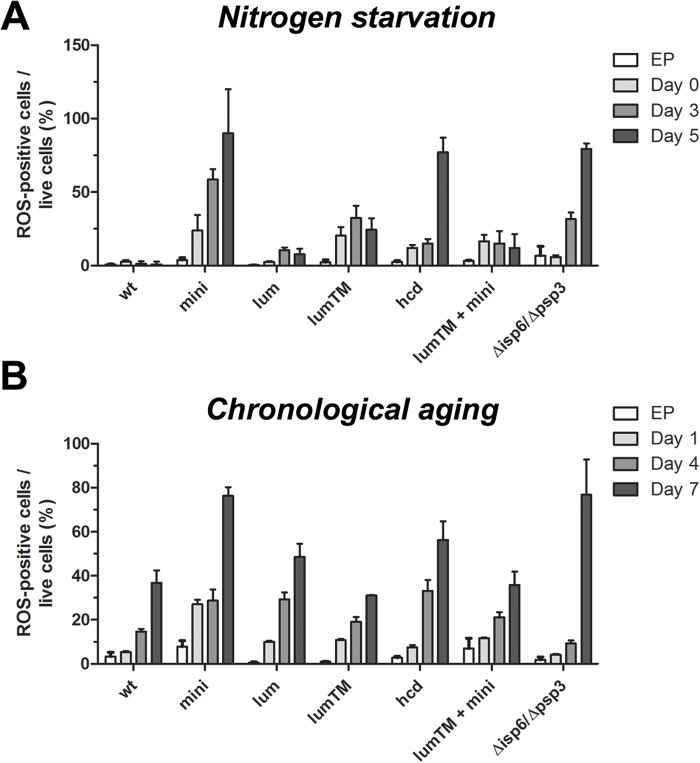
Fig 7. High levels of ROS accompany the death of mini_cnx1 cells under nitrogen starvation and chronological aging.
Accumulation of ROS in cells under nitrogen starvation (A) and (B) during aging cultures (CLS), was determined using dihydroethidium (DHE) staining. Calnexin mutants mini_cnx1 (mini, SP18344), lumenal_cnx1 (lum,SP18346), lumenalTM-cnx1 (lum-tm, SP18348), Δhcd_cnx1 (hcd, SP18350), mini_cnx1+lumenalTM-cnx1 (lum-tm + mini, SP18282) were evaluated in comparison to WT calnexin (WT,SP18342), and to the vacuolar-proteases deficient strain isp6psp3 (SP18417). (A) Cells were grown in minimal media (EMM) until exponential phase (0.3–0.4 OD/ml), washed twice in water, and then starved for nitrogen in EMM minus nitrogen (EMM-N). Culture samples were taken at exponential phase (EP) and days 1, 4 and 6 of nitrogen-starvation, stained with DHE (10 μM) for 30 min at 30°C. Sample of 10000 cells were analyzed by flow cytometry (BD FACSAria). (B) Cells were grown in CLS medium [EMM supplemented with all amino acids at 112 mg/L (EMMC)]. Culture samples were taken at EP and days 1, 4 and 7 of stationary phase and processed as above for DHE staining. For each-bar graph, data represent means ± s.e.m. of DHE-positive cells per viable cells (as determined by Phloxin B staining, see M&M). Each experiment was repeated at least three times.

