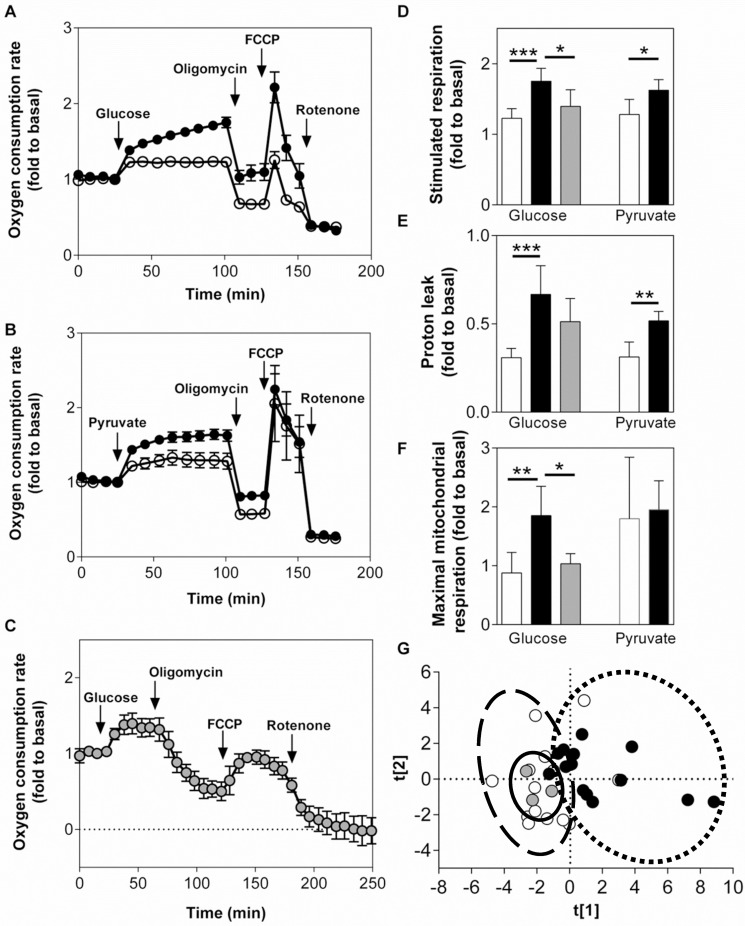
Fig 3. Respiration in EndoC-βH1, INS-1 832/13 cells and human islets.
Oxygen consumption rates relative to basal (1 mM glucose) OCR upon glucose stimulation (20 mM; A, C) or pyruvate stimulation (10 mM; B) in EndoC-βH1 cells (A, B; white symbols), INS-1 832/13 cells (A, B; black symbols) and human islets (C; grey symbols). Glucose- and pyruvate-stimulated respiratory response (D), proton leak (oligomycin-insensitive glucose-stimulated respiration) (E) and maximal mitochondrial respiration (F) each expressed as fold relative to basal. (G) Principal component analysis of respiratory parameters (EndoC-βH1—dashed line, INS-1 832/13—dotted line, human islets—solid line) (PCA: R2X = 0.896; R2Y = 0.684; A = 3). All calculations were done after subtracting non-mitochondrial respiration. Data are represented as mean ±S.E.M (n = 8 for glucose, n = 4 for pyruvate and n = 3 for human islets). Statistical analysis was done as described in methods. *p<0.05, **p<0.01, ***p<0.001.

