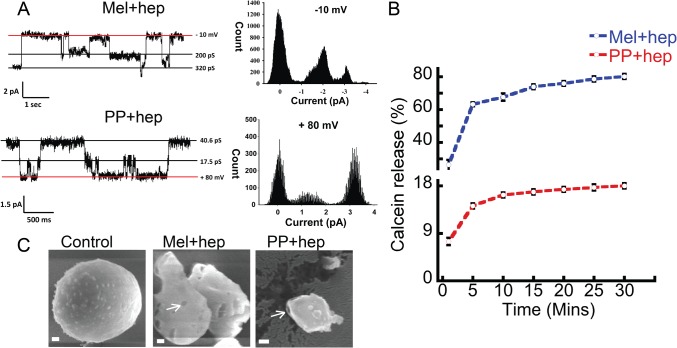
Fig 10. Membrane damage by oligomers.
(A) Representative single channel current traces; exhibited by oligomeric species at different holding potentials. Channel insertion was initiated by adding 1 μM of Mel and PP oligomers to the cis chamber. All point histogram of the corresponding current trace is shown at the right side. Clamping potentials (mV) are indicated along the right side of the current traces. Conductance values (in pS) of different states are indicated on the right side of current traces. Red horizontal line represents a base line (0 pA). (B) Calcein release assay showing leakage of the calcein dye after addition of oligomers to the calcein-loaded liposomes. A high calcein fluorescence was observed when calcein was released to the solution. (C) Cryo-SEM images of liposomes showing the direct visualization of pore and membrane damage in the presence of oligomers. Arrows indicate the pore-like structures in the liposomes. Scale bars are 100 nm.

