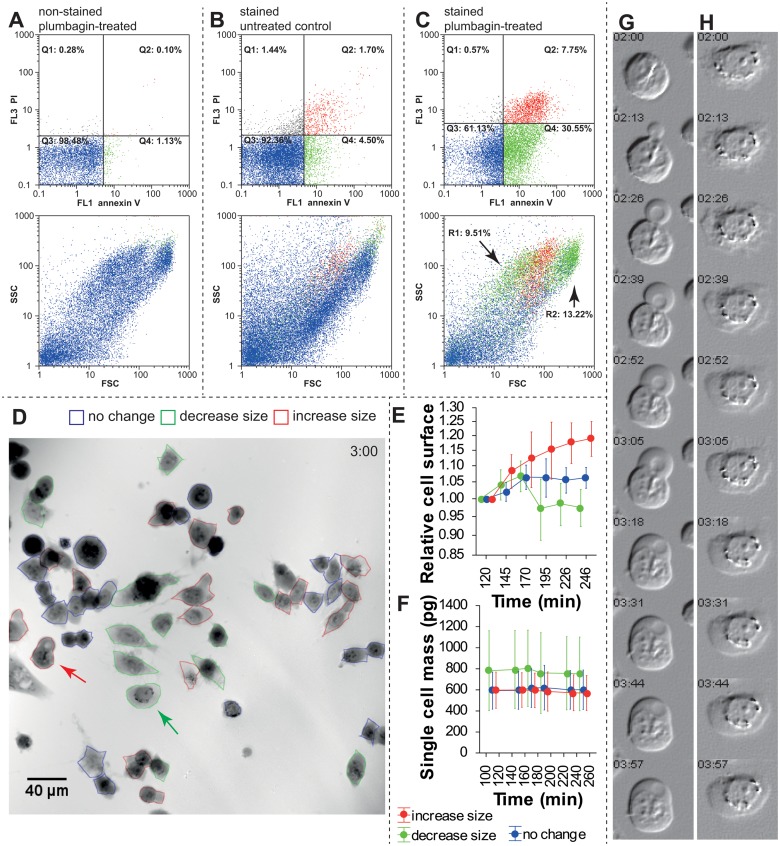
Fig 2. Differences in cell death estimation between flow cytometry and holographic microscopy.
A. Plumbagin treatment, no annexin V/PI staining, used for gating set-up. Upper dot plot indicates annexin V/PI fluorescence, lower dot plot indicates FSC/SSC of these cells colour-coded according to gating regions. B. Annexin V/PI staining, untreated cells. 92% are double negative for staining. C. Annexin V/PI staining after 3 h of the experiment. See increased populations of annexin V-positive (green gating) and double positive (red staining). In FSC/SSC scatter plot, arrows indicate two populations (gating regions) of annexin V+/PI− cells: (R1) smaller cells (lower FSC) and (R2) larger cells (higher FSC). See the Results section for details. D. Multimodal holographic microscope, phase image. 10 × magnification 3 h after 2 μM plumbagin treatment. Red-outlined cells show size increase and oncotic phenotype, green-outlined cells show surface area decrease and apoptotic phenotype, blue-outlined cells show no changes during 2 h monitoring. For typical morphological criteria of oncotic/apoptic cells see (Table 1) E. Relative change of cell surface in individual cells (relative to initial time point). Colour coding of individual cells is based on (D). F. Mass of individual cells in pg. Note a significantly higher mass of the “decrease-size” cell population. G. Time-lapse of typical oncotic “increase size” cell indicated by red arrow in (D), simulated digital interference microscopy H. Time-lapse of typical “decrease size” apoptotic cell indicated by green arrow in (D). Simulated digital interference microscopy. FSC—forward scatter, SSC—side scatter, PI—propidium iodide.

