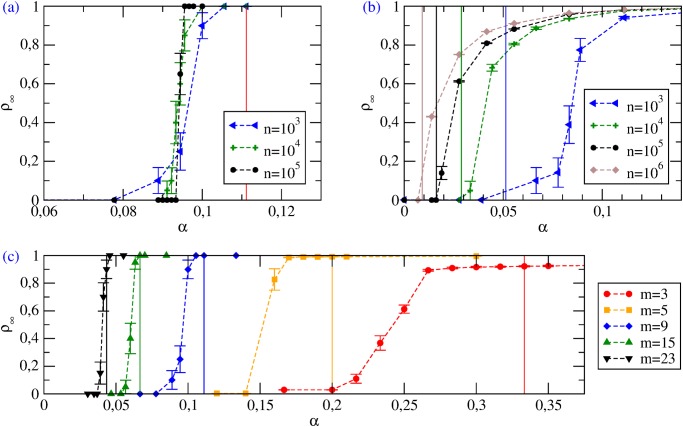
Fig 3. Coordination games with Proportional Imitation.
Stationary cooperation levels ρ ∞ vs α. The vertical solid lines identify the values of α c. (a) ER graphs with m = 9 and various n. (b) SF networks with γ = 2.5 and various n; here α c values were estimated from Equation (10) as . (c) ER graphs with n = 103 and various m. Note that for small values of m such that p = m/(n−1) < ln(n)/n the graph is disconnected: isolated nodes are bound to their initial action, so that full defection and full cooperation are not accessible states; additionally, defective behavior spreads easily inside isolated components which are poorly connected (also for high α), so that ρ ∞ remains far from 1.

