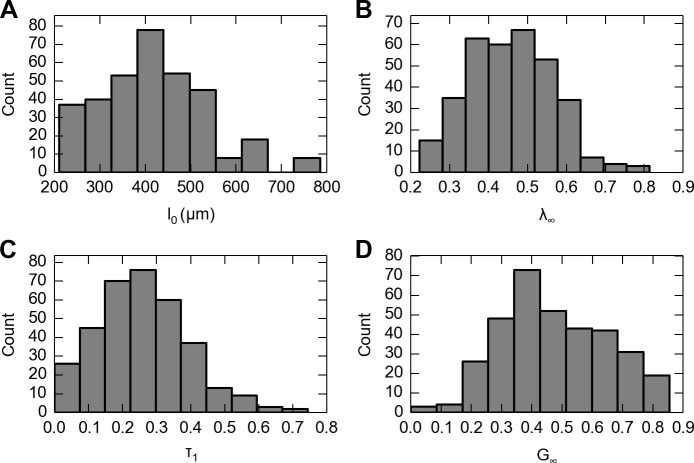
Fig 5. Data from 341 experimental runs (n = 41 specimens) each stimulated an average of eight stretch levels.
Distributions are shown of A: skin thickness measurements; B: steady-state skin stretches (λ ∞) applied; C: time constants from fitting stress versus time to the one-term QLV model; D: the steady-state residual stress ratio G ∞. Note that each of the four variables exhibits high variability.

