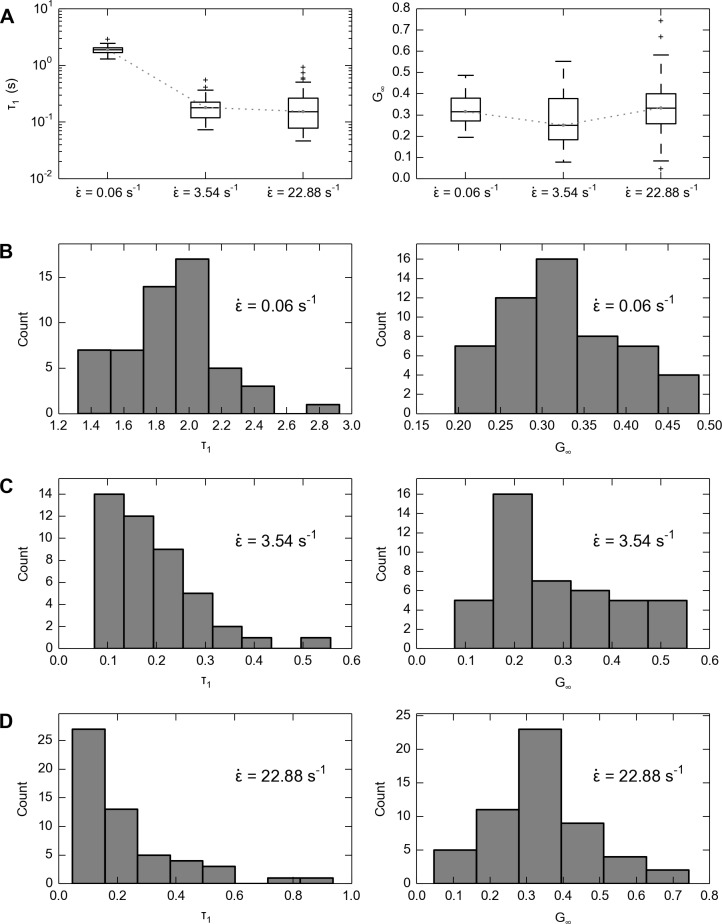
Fig 7. Values of time constant (τ 1) and residual stress ratio (G ∞) at three strain rates ().
A: Overall, the time constants are significantly smaller under faster strain rates, while there is no systematic trend in the change of residual stress ratio. The boxes range from the lower quartile to upper quartile, the centerlines denote the medians, the whiskers denote extreme values and crosses denote outliers. B-D: Detailed views of the distributions of time constants and residual stress ratios from all data points at B: strain rate 0.06 s−1, n = 54; C: strain rate 3.54 s−1, n = 44; D: strain rate 22.88 s−1, n = 54.

