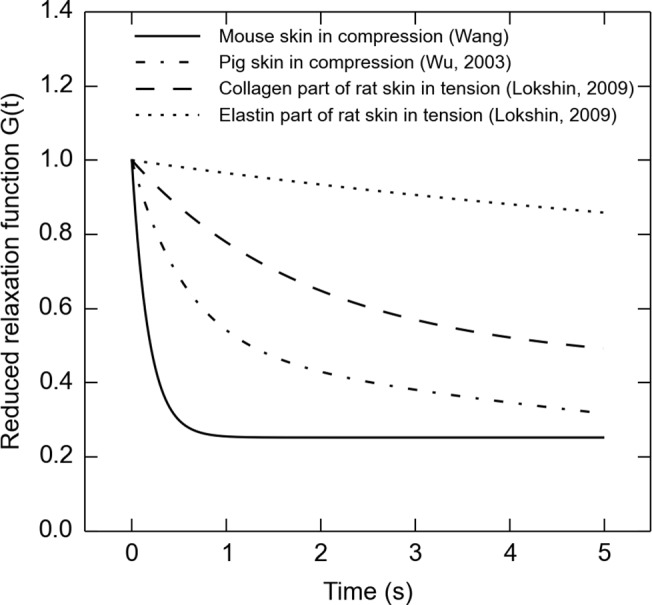
Fig 8. Comparison of the reduced relaxation function (Equation 5) from measurement of different skin samples.

The solid line shows median data from work presented here on mouse hindlimb skin fitted to the one-term model, in the first experiment with median strain rate . The dotted-dash line gives a measurement from pig dorsal skin [11]. The dashed and dotted lines are both from rat skin, but the dashed line function is attributable only to collagen elements in the skin while the dotted function is only elastin elements [4]. Note that the skin in compression relaxes more than skin in tension.
