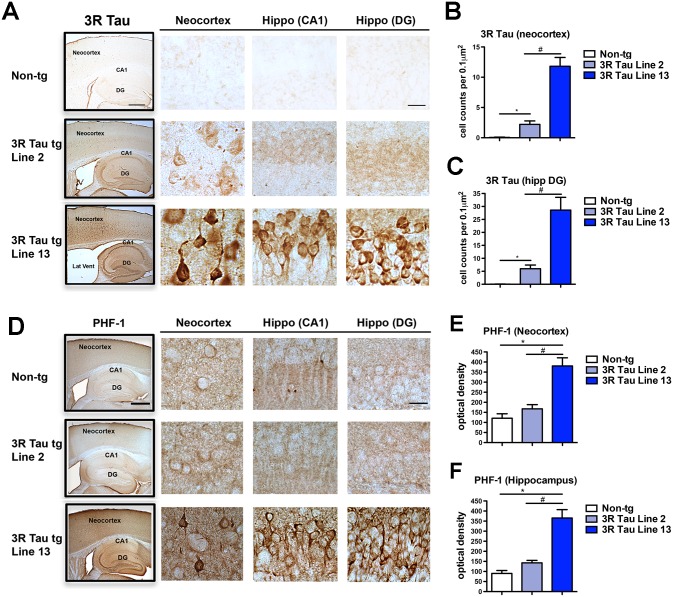
Fig 6. Comparison of the patterns of 3R and pTau distribution in the brains of the low and higher expresser mutant 3R Tau tg mice.
A. Vibratome sections were immunostained with an antibody against 3R Tau and analyzed by digital bright field microscopy. Panels to the left are low-magnification (20X) photomicrographs of regions of interest, including the neocortex, hippocampus CA1 and dentate gyrus (DG) regions in the non-tg and mutant 3R Tau tg Lines 2 and 13 lines mice. Panels to the right are higher magnification (600X) of the corresponding regions displaying low levels of 3R Tau immunoreactivity in neuronal cells bodies in Line 2 and high levels of immunostaining in Line 13. B. Image analysis of numbers of neuronal cells in the neocortex and C dentate gyrus displaying 3R Tau aggregates. D. Vibratome sections were immunostained with the PHF-1 antibody against pTau (Ser396 and Ser404) and analyzed by digital bright field microscopy. Panels to the left are low-magnification (20X) photomicrographs of regions of interest, including the neocortex, hippocampus CA1 and DG regions in the non-tg and mutant 3R Tau tg Lines 2 and 13. Panels to the right are higher magnification (600X) of the corresponding regions displaying low levels of PHF-1 immunoreactivity in neuronal cells bodies in Line 2 and high levels of immunostaining in Line 13. Image analysis of the overall levels of PHF-1 immunoreactivity expressed as optical density in the E neocortex and F dentate gyrus. Mice were 8–10 month old. N = 12 non-tg, N = 12 3R Tau tg Line 2, N = 12 3R Tau tg Line 13. * = P < 0.05 compared with non-tg by one-way ANOVA with Dunnet post hoc analysis. # = P < 0.05 when comparing Line 2 and 13 using one way ANOVA with Tukey-Kramer posthoc test. Low magnification box scale bar = 250 μm; high power panels scale bar = 25 μm.

