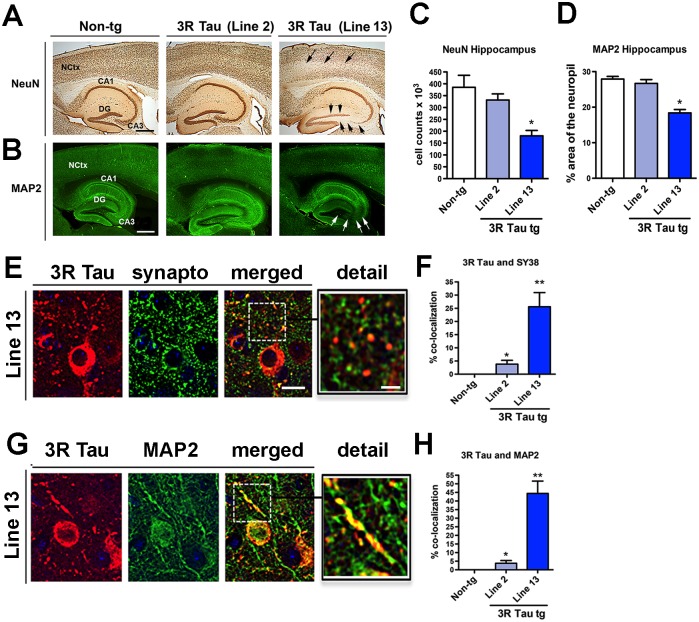
Fig 10. Analysis of neurodegeneration and synaptic-dendritic distribution of 3R Tau in the higher expresser mutant 3RTau tg mice.
A and B. Vibratome sections were immunostained with antibodies against the neuronal marker NeuN (visualized with DAB, bright field microscopy) and the dendritic marker MAP2 (visualized with FITC, confocal microscopy). Compared to the non-tg and lower expresser Line 2, Line 13 mice had decreased immunoreactivity in the neocortex (arrows) and hippocampus (arrowheads). C and D. Image analysis for the numbers of NeuN positive cells and area of the neuropil covered by MAP2 immunoreactive dendrites in the hippocampus showing a significant reduction in the mutant 3RTau tg Line 13 compared to Line 2 and non-tg controls. E. Sections were double-labeled with antibodies against human 3R Tau (red channel) and synaptophysin (SY38, green channel) and imaged with the laser scanning confocal microscope. Split panels show the somatic and synaptic localization of 3RTau and co-localization with synaptophysin in the hippocampus. The box to the right represents a zoomed area for the dashed box to the left showing details about the co-localization. F. Image analysis for the % of synaptophysin terminals showing 3R Tau immunoreactivity. G. Sections were double-labeled with antibodies against human 3R Tau (red channel) and MAP2 (green channel) and imaged with the laser scanning confocal microscope. Split panels show the somatic and dendritic localization of 3R Tau in the hippocampus. The box to the right represents a zoomed area for the dashed box to the left showing details about the co-localization. H. Image analysis for the percent of MAP2 dendrites showing 3R Tau immunoreactivity between the two synaptic markers. Scale bars in the single channel images = 25 μm and 5 μm in the enlarged merged images. Mice were 8–10 month old. N = 12 non-tg, N = 12 3R Tau tg Line 2, N = 12 3R Tau tg Line 13. * = P < 0.05 and ** = P < 0.01, respectively, compared with non-tg by one-way ANOVA with Dunnet post hoc analysis.

