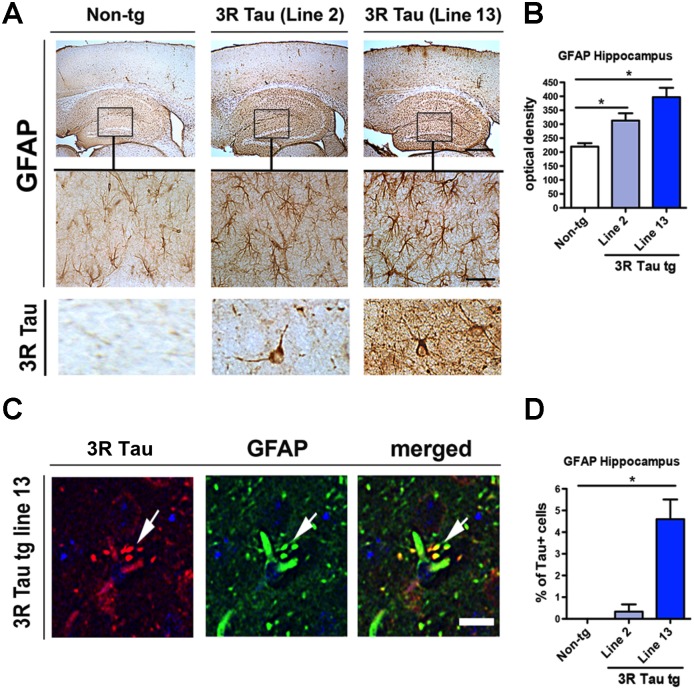
Fig 11. Analysis of astroglial cells in the higher expresser mutant 3R Tau tg mice.
A. Sections were immunolabeled with antibodies against GFAP and imaged with a digital bright field microscope. Representative low power (20X) photomicrographs of the neocortex and hippocampus from non-tg and mutant 3R Tau tg mice displaying increased GFAP immunoreactivity in the tg mice. Higher magnification (600X) images of the hippocampus corresponding to the area in the box showing the astroglial cells in the hippocampus. Bottom panel represents cells immunostained with antibody against 3R Tau displaying a glial-like appearance. B. Image analysis for levels of GFAP immunoreactivity in the hippocampus expressed as optical density showing increased levels in tg mice compared to non-tg controls. C. Sections double-labeled with antibodies against GFAP (green channel) and human 3R Tau (red channel) and imaged with the laser scanning confocal microscope. Split panels showing processes of astroglial cells displaying localization of 3R Tau (arrows). D. Image analysis for the percent of GFAP positive cells showing 3R Tau immunoreactivity. Mice were 8–10 month old. N = 12 non-tg, N = 12 3R Tau tg Line 2, N = 12 3R Tau tg Line 13. * = P < 0.05 compared with non-tg by one-way ANOVA with Dunnet post hoc analysis. Scale bar for upper panel in A = 100 μm and 50 μm for the lower panel. Scale bar for panel in C = 10 μm.

