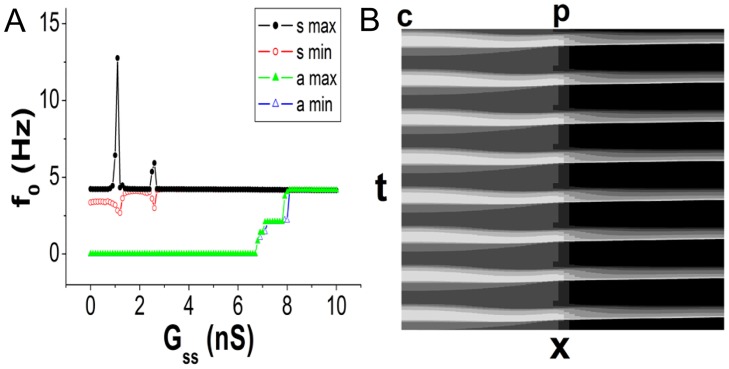
Fig 2. Synchronization and pacing ability of the system without an AS.
A: The maximum and minimum frequencies of the SAN (the circles) and atrial tissue (the triangles) as functions of G ss (G sa = 20 nS). When G ss ≥ 3.8 nS, synchronization is achieved in the SAN. Between 6.8 nS and 8 nS, the atrium is paced but not 1:1 synchronized with the SAN. When G ss > 8 nS, normal beating of the tissue is realized. B: The spatiotemporal pattern of the normal beating of the system (G ss = 20 nS and G sa = 20 nS). The abscissa labeled x indicates the positions of the cells, and the ordinate labeled t denotes the time. “c” and “p” denote the central and peripheral ends of the SAN, respectively. The membrane voltages are shown by colors ranging from black to white. The lighter the color is, the larger the value.

