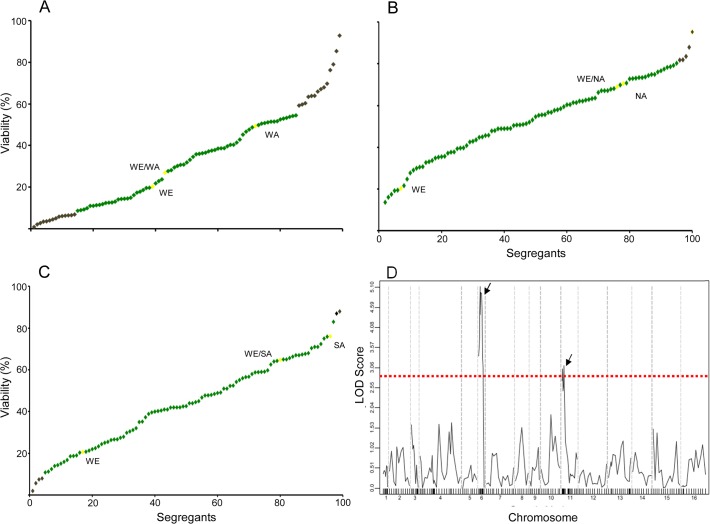
Fig 1. Viability rate variation after dehydration stress.
Viability rate values are shown on the y-axis for the 96 ranked segregants of the WE x WA cross (A), WE x NA cross (B), and WE x SA cross (C). Dots indicate segregants with transgressive phenotypes (exceeding two parental standard deviations, black), parental and hybrid strains (yellow), and segregants within the phenotypic range of the parental strains (green). D) Linkage analysis for dehydration stress tolerance from WE/WA segregants. The chromosomes are displayed on the x-axis, and LOD viability values, according to each molecular marker across the 16 yeast chromosomes, are displayed on the y-axis. The significant LOD score threshold is indicated by a red line and was determined by a permutation test. The significant QTLs are indicated by arrows.

