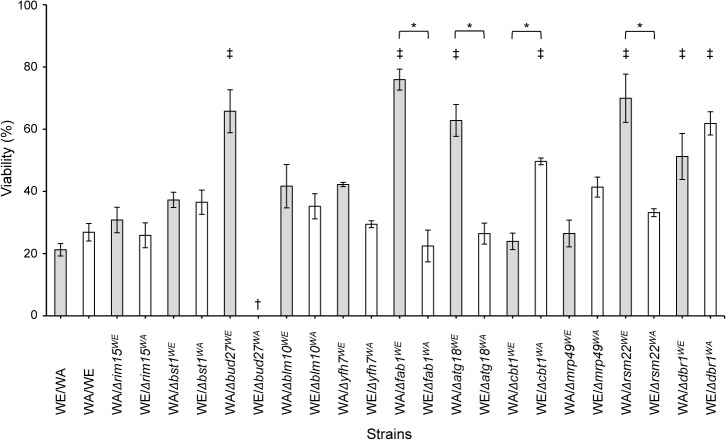
Fig 3. Hybrid viability after DRS.
The scale of viability (%) indicates the percentage of experimental values for the different strains.
The values shown are the means of at least n = 3 independent samples ± SD. † Non-viable strain. *Significant differences at p≤0.01 between hemizygous strains. ‡ Significant differences at p≤0.01 between the hemizygous and reference strains.

