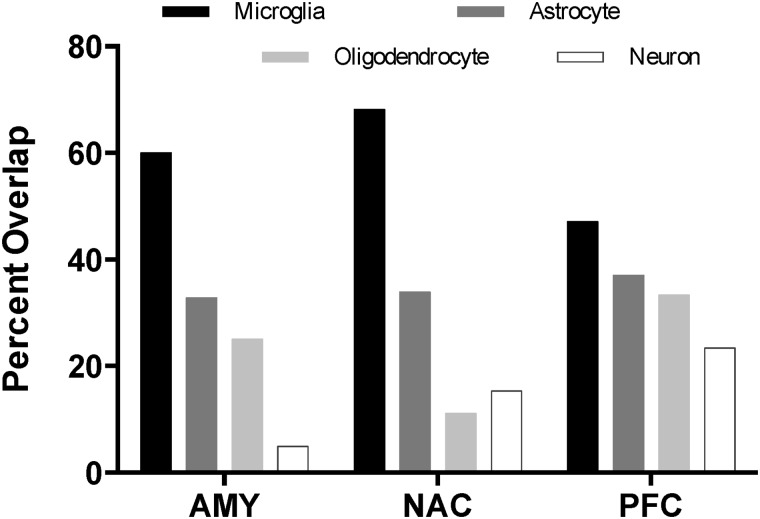
Fig 4. Overlap of cell-specific, differentially expressed genes at 0- and 8-hours after CIE vapor.
Bars show the percentage of cell type-specific genes differentially expressed (FDR ≤ 0.05) at both the 0- and 8-hour time points. Percentages are based on the total number of differentially expressed, cell type-specific genes at time 0. (AMY = amygdala; NAC = nucleus accumbens; PFC = prefrontal cortex).

