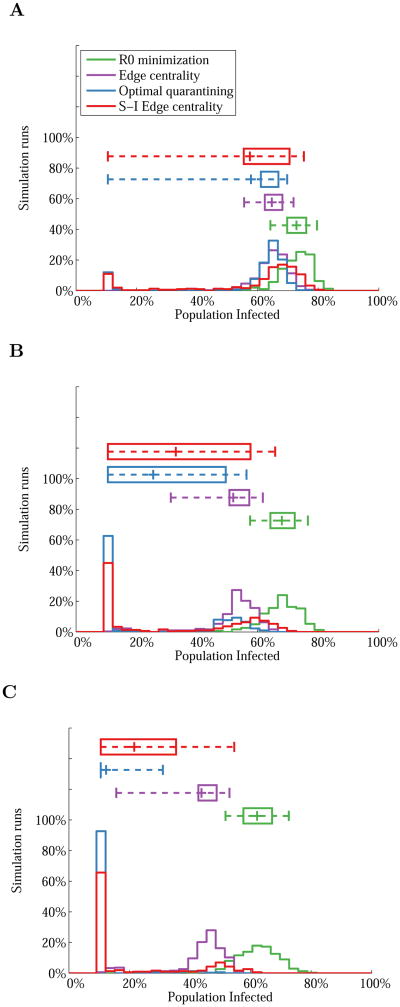
Figure 4.
Distribution of the final outbreak sizes over 300 random sets of initially infected nodes in the residential hotel network with link removal budgets of (A) K = 10%, (B) K = 20%, and (C) K = 30%. Disease spread was simulated with β/δ = 0.5 (R0 ≈ 5). Average values are indicated by ‘+’ and box plots show interquartile ranges and 95% intervals.

