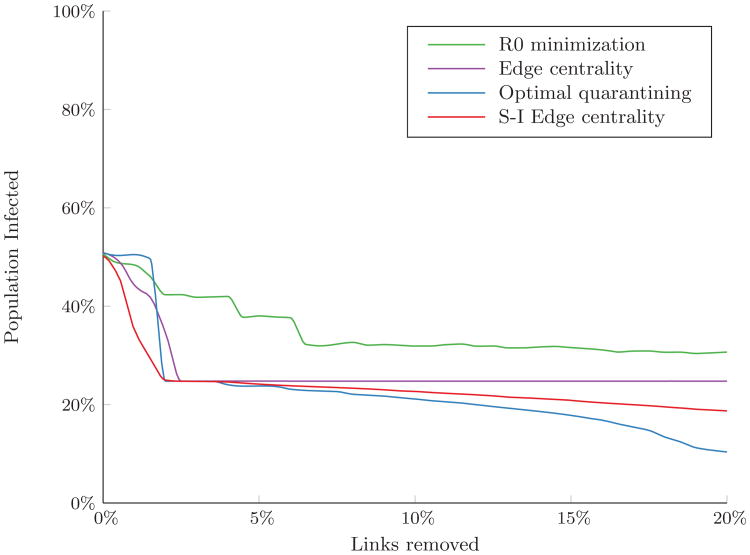
Figure 6.
Percent of the population infected over the course of an outbreak in a network exhibiting community structure with four sub-populations. Simulated with β/δ = 0.34 (R0 ≈ 5) and 10% of nodes initially infected. Results are the average of 300 random sets of initially infected nodes in one of the highly connected sub-populations.

